
 Home
Home News
News
- 1 V stock price increased slightly by 0.20% over the past 24-Hour and the current volume is below average volume.
- 2 Visa Inc. ( NYSE: V) stock’s 52-week price range is $208 – $245.
Visa stock performed well in the last month, increasing by 1.16% and by 4.72% in the last six months. Visa Inc. (NYSE: V) stock has a positive year-to-date return of 14.56% and a positive one-year return of 13.09%. The average volume is 5.526 Million and the current volume is 4.055 Million where the current volume is below average volume.

Moreover, Visa Inc’s (V) stock market capitalization is $488.767 Billion and the total revenue is $29.31 Billion. Moreover, the stock’s basic EPS is $7.89 and the price-to-earnings ratio is 30.90. Visa has a debt-to-equity ratio of 52.7%, as reported by Simply Wall St. This implies that it has more debt than equity, which is the difference between its total assets of $89.23 Billion and total liabilities of $50.25 Billion. Visa’s debt is $20.56 Billion, while its equity is $38.98 Billion.

Technical Analysis of V Stock Stock Price in 1-D Timeframe
The price action shows that Visa Inc’s ( NYSE: V) stock price has been on an inclining trend for the last three months, increasing by 3.90% making higher highs and higher lows, and rising. At the time of writing, V stock is trading at around $239.76 and facing resistance from trendline.
Therefore, if the V price fails to sustain the current level and drops, it might hit the nearest support levels of $234.42 and $225.96.
However, if it maintains the current level, the V prices could continue to move upward and reach the first and second resistances of $245.23 and $254.73.
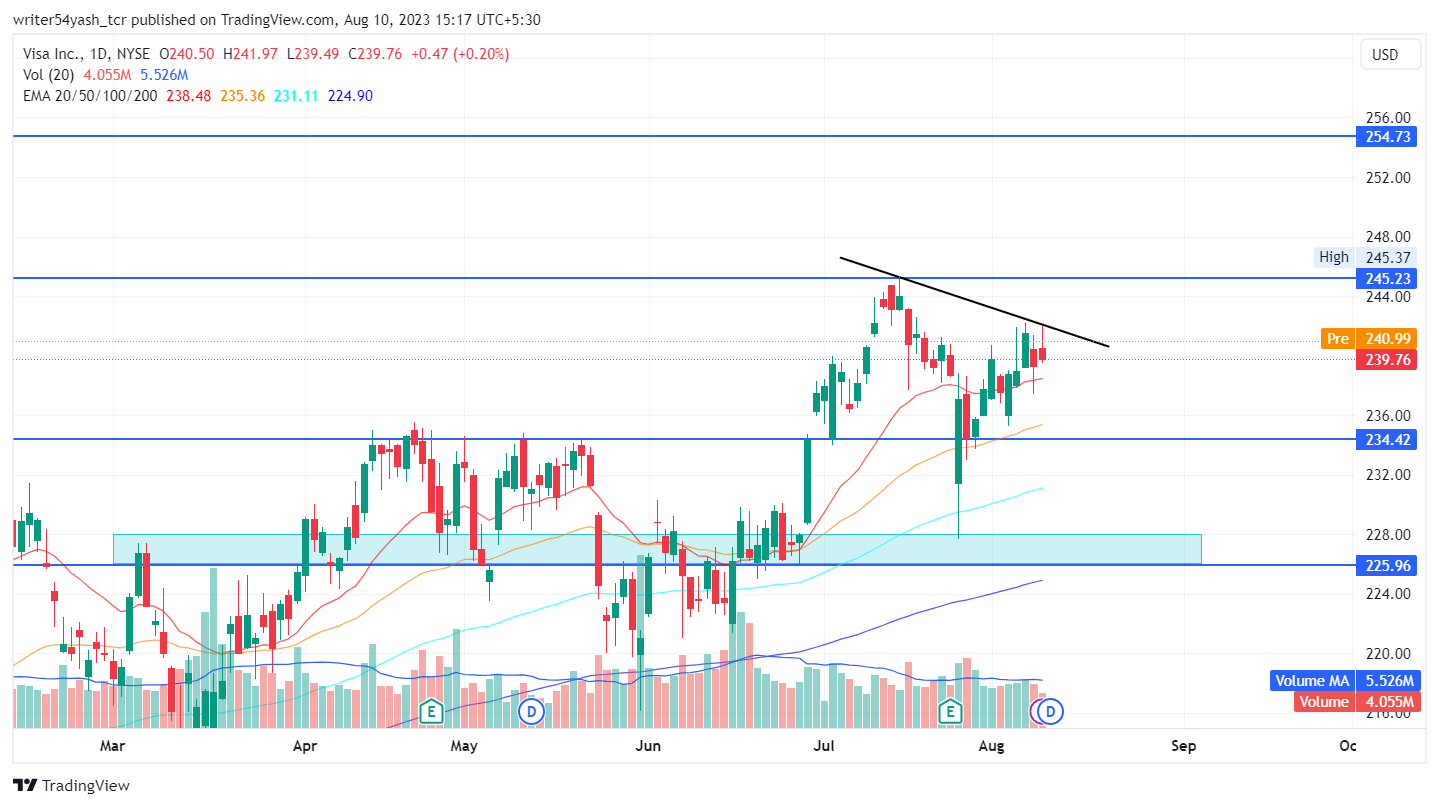
At the time of publishing, Visa Inc. (NYSE: V) is trading above the 20, 50, 100, and 200-day EMA (exponential moving averages), which supports the V price trend.
However, the stock price is facing resistance from the trendline, and if more selling volume adds up then the price might conquer supporting EMA’s by making lower highs and lows.
Hence, the V price is expected to move downwards showing bearish views over the daily time frame chart.
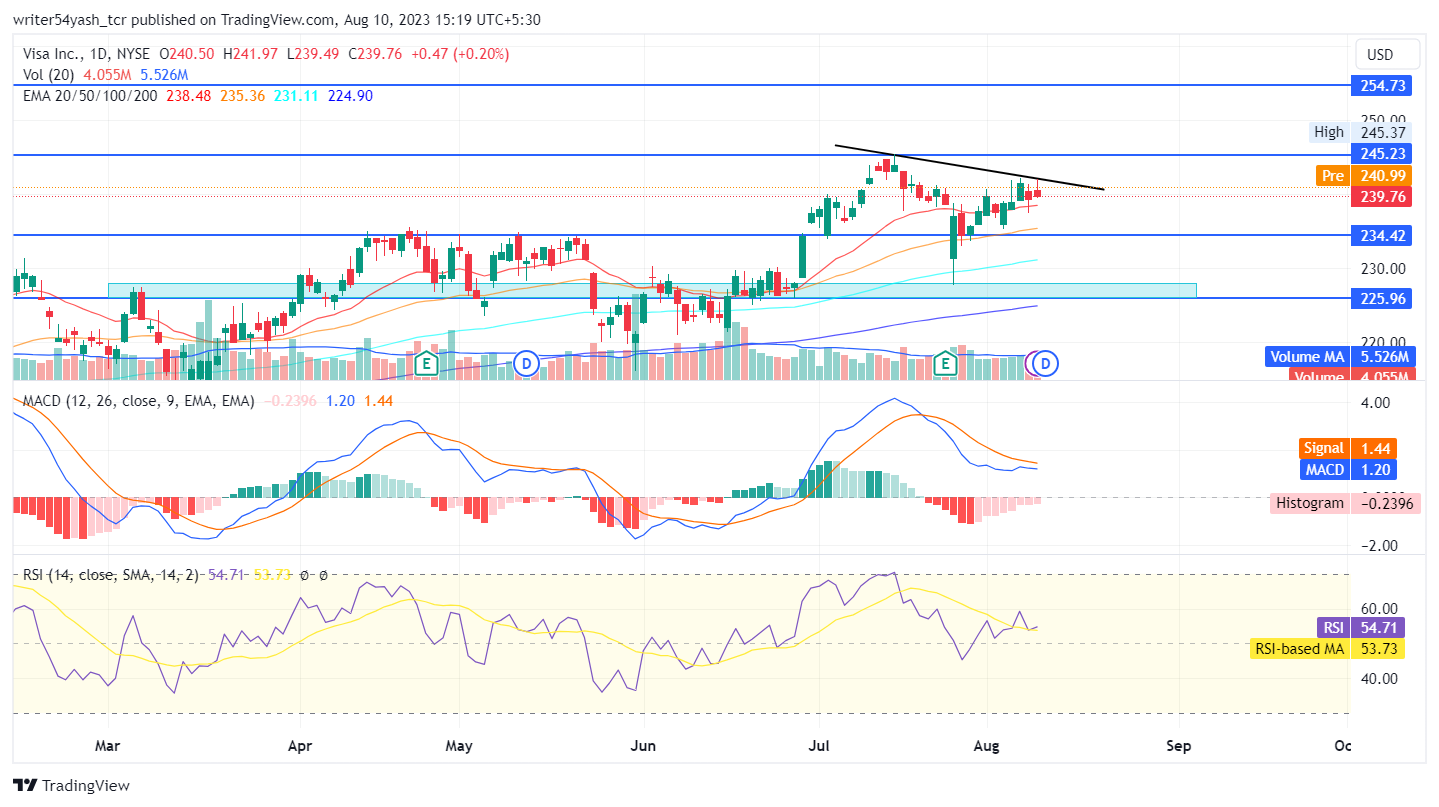
The current value of RSI is 54.71 points. The 14 SMA is at the median line at 53.73 points which indicates that V stock is neutral as the RSI at the neutral line indicating the consolidation to bearishness.
The MACD line at 1.20 and signal line at 1.44 are above the zero line and both lines have crossed each other. A bearish crossover is observed in the MACD oscillator which might signal more bearishness for the V stock price.
Summary
Visa Inc. (NYSE: V) indicates that the investors and traders of the stock price are bearish on the 1-D time frame. The price action reflects a bearish outlook at the time of publishing. The technical analysis tools of the V stock price also support the bearish trend. The MACD, RSI, and EMA highlight negative signals and imply that the downtrend may continue in Visa’s stock price.
Technical Levels
- Support levels: The nearest support levels for V’s stock price are $234.42 and $225.96.
- Resistance levels: The nearest resistance levels for V stock price are $245.23 and $254.73.
Disclaimer
In this article, the views and opinions stated by the author, or any people named are for informational purposes only, and they don’t establish the investment, financial, or any other advice. Trading or investing in cryptocurrency assets comes with a risk of financial loss.
Steve Anderson is an Australian crypto enthusiast. He is a specialist in management and trading for over 5 years. Steve has worked as a crypto trader, he loves learning about decentralisation, understanding the true potential of the blockchain.


