
 Home
Home News
News
- 1 AAPL stock price decreased by 7.10% over the past week and by 5.92% over the past month.
- 2 Apple Inc ( NASDAQ: AAPL) stock’s 52-week price range is $131 – $198.
Apple stock has not performed well in the last month, decreasing by 5.92% but surging by 19.08% in the last six months. Apple Inc. (NASDAQ: AAPL) stock has a positive year-to-date return of 36.61% and a positive one-year return of 6.14%. The average volume is 58.085 Million and the current volume is 54.687 Million where the current volume is below average volume.
Moreover, Apple Inc. (AAPL) stock market capitalization is $2.782 Trillion and the total revenue is $394.328 Billion. Moreover, the stock’s basic EPS is $5.98 and the price-to-earnings ratio is 29.95. Apple has a debt-to-equity ratio of 181.3%, as reported by Simply Wall St. This implies that it has more debt than equity, which is the difference between its total assets of $335.04 Billion and total liabilities of $274.76 Billion. Apple’s debt is $109.28 Billion, while its equity is $60.27 Billion.
Technical Analysis of AAPL Stock Stock Price in 1-D Timeframe
The price action shows that Apple Inc’s ( NASDAQ: AAPL) stock price took support at $143.89 and had been on an inclining trend for the last six months, increasing by making higher highs and higher lows and reaching a $196.49 level.
At the time of writing, AAPL stock is trading around $177.97 and faced a significant fall from resistance at $187.25, declining from the last week making lower highs and lows.
Therefore, if the AAPL price fails to sustain the current level and drops, it might hit the nearest support levels of $170.59 and $167.30.
However, if it maintains the current level, the AAPL prices could continue to move upward and reach the first and second resistances of $187.25 and $190.95.
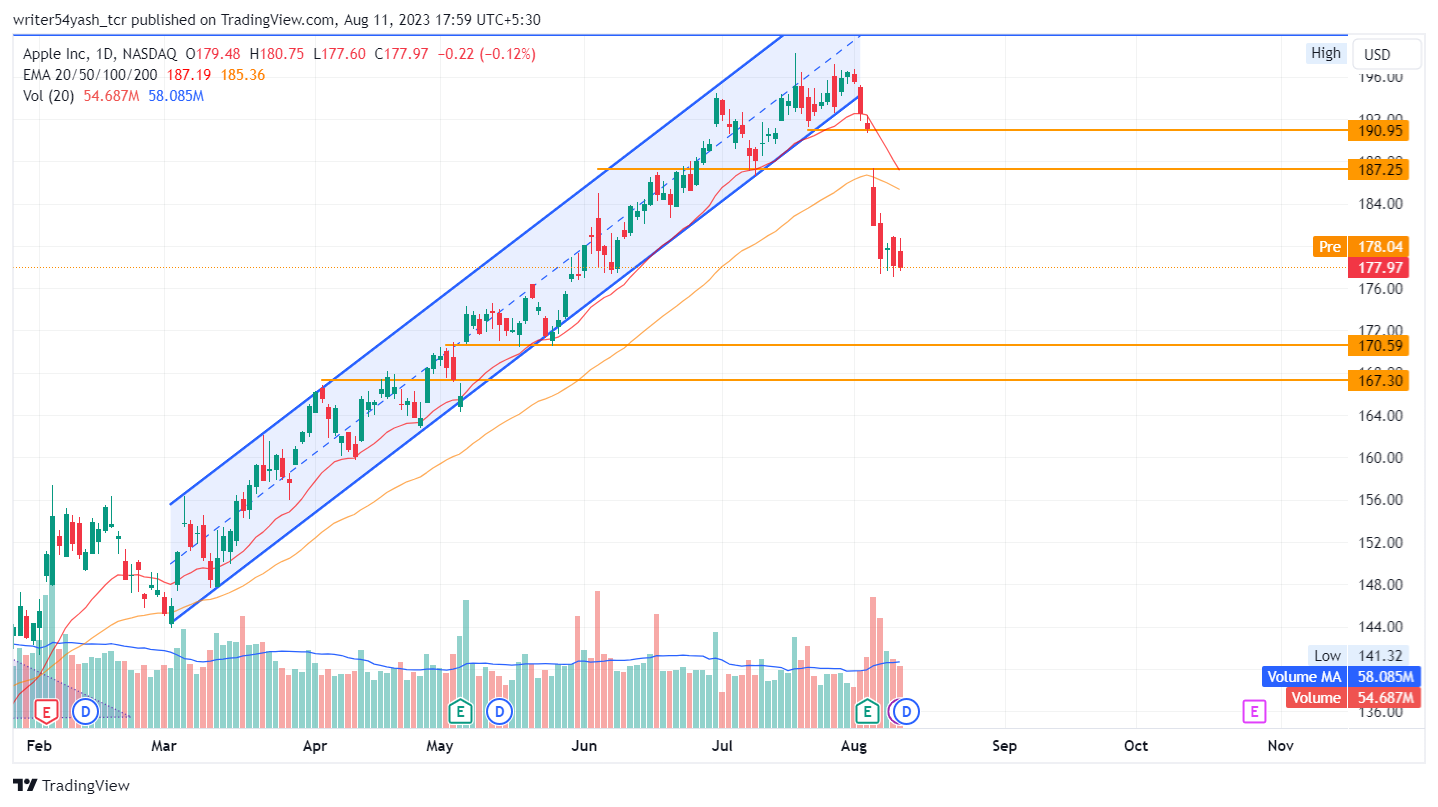
At the time of publishing, Apple Inc. (NASDAQ: AAPL) is trading below the 20, and 50-day EMA (exponential moving averages), which rejects the AAPL price trend.
Hence, the AAPL price is expected to move downwards showing a bearish overview over the daily time frame chart.

The current value of RSI is 29.84 points. The 14 SMA is at the median line at 50.14 points which indicates that Apple stock is in bearish territory and below 14 SMA, indicating the bearishness for Apple stock.
The MACD line at 2.25 and signal line at 0.0294 are above the zero line and both lines have crossed each other. A bearish crossover is observed in the MACD oscillator which might signal more bearishness for the Apple stock price.
Summary
Apple Inc. (NASDAQ: AAPL) indicates that the investors and traders of the stock price are bearish on the 1-D time frame. The price action reflects a bearish outlook at the time of publishing. The technical analysis tools of Apple’s stock price also support the bearish trend. The MACD, RSI, and EMA highlight negative signals and imply that the downtrend may continue in Apple’s stock price.
Technical Levels
- Support levels: The nearest support levels for Apple’s stock price are $170.59 and $167.30.
- Resistance levels: The nearest resistance levels for the Apple stock price are $187.25 and $190.95.
Disclaimer
In this article, the views and opinions stated by the author, or any people named are for informational purposes only, and they don’t establish the investment, financial, or any other advice. Trading or investing in cryptocurrency assets comes with a risk of financial loss.

Nancy J. Allen is a crypto enthusiast, with a major in macroeconomics and minor in business statistics. She believes that cryptocurrencies inspire people to be their own banks, and step aside from traditional monetary exchange systems. She is also intrigued by blockchain technology and its functioning. She frequently researches, and posts content on the top altcoins, their theoretical working principles and technical price predictions.


