
 Home
Home News
News

- 1 The Frax Coin price increased by 2.80% over the last 24 hours and by 4.73% over the past week.
- 2 At press time, Frax Coin is trading at $6.2240, and the 52-week price range is $4.57 – $10.89.
Frax is a specially designed stable coin whose products are partly proprietary and partly powered by an algorithm. The Frax protocol consists of two tokens: the stablecoin Frax (FRAX) and the management token Frax Shares (FXS).
FXS Coin crypto surged 1.31% in market value and plummeted by 22.90% in trading volume, in the last 24 hours, according to Coinmarketcap, a crypto analysis website. Its market value is $451,134,951 and its trading volume is $18,889,101. There are 72,820,861 FXS in circulation.

Moreover, the Frax Coin has not shown good performance this month as it is down by 1.04% and by 41.08% in the past six months. But the year-to-date return of FXS price is positive with a 50.94% incline.
Frax Coin Price Technical Analysis in 1-D Timeframe
The Frax Coin price rose with strong support at $4.579 creating a series of higher highs and higher lows after a long downtrend. At the time of publishing the FXS coin is trading around $6.2011 and facing resistance at $6.727 level.
Therefore, if the FXS Coin price sustains this level, it may continue to rise and hit the targets of $6.727 and $7.478. Alternatively, if the Frax Coin price rejects this level and falls, it may reach the nearest support levels of $5.817 and $5.305.
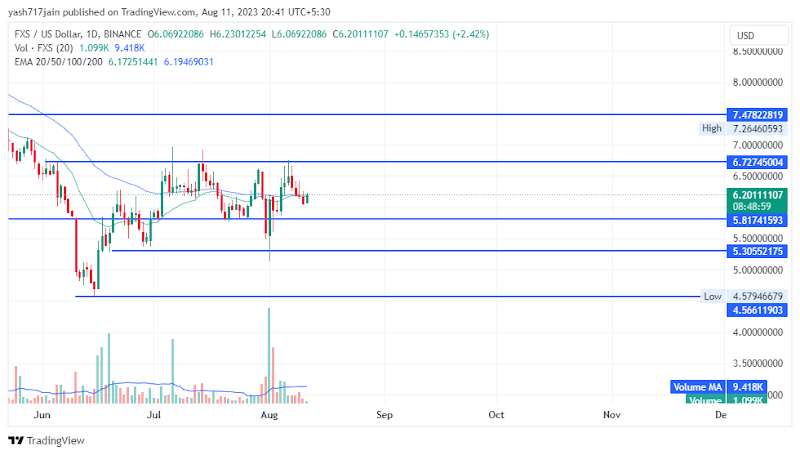
Frax Coin price (FXS) is above the 20, and 50-day EMA (exponential moving average). The EMA is acting as support, pushing the price trend up. Therefore, FXS Coin price prediction suggests that the coin price could spike if the buyers accumulate more.
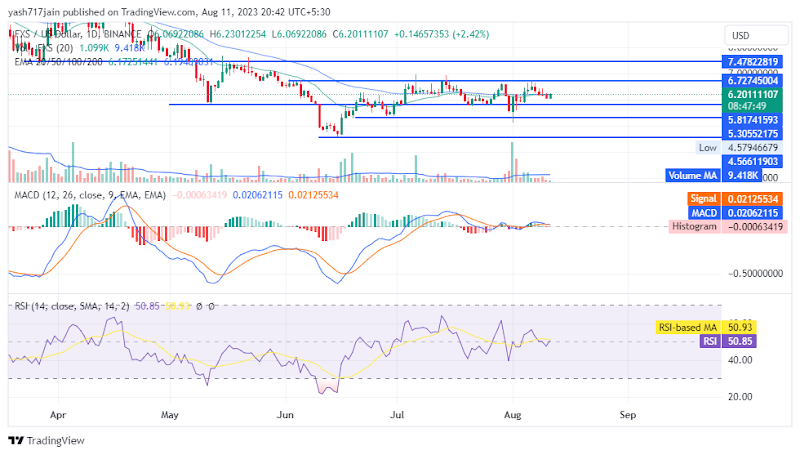
The MACD line at 0.0206 and the signal line at 0.0212 are both above the zero line. They are also intertwined, indicating a consolidation phase in the market and a possible bullish crossover soon. The RSI value is 50.85 points, and the 14 SMA is at 50.93 points. The RSI line was rejected earlier and now it has changed direction. Therefore, the FXS Coin price prediction suggests that the coin price is consolidating.
Conclusion
FXS Coin chart shows investors are indecisive regarding the coin on the 1-D time frame. The FXS price action reflects a consolidation to bullish outlook at the time of publishing. The major indicators are giving indecisive signals and imply that the consolidation may continue. Hence, as per FXS Coin price prediction, the coin is in consolidation to a bullish state.
Technical Levels:
- The nearest support levels are $5.817 and $5.305.
- The closest resistance levels are $6.727 and $7.478.
Disclaimer
In this article, the views and opinions stated by the author or any people named are for informational purposes only, and they don’t establish the investment, financial, or any other advice. Trading or investing in cryptocurrency assets comes with a risk of financial loss.

Adarsh Singh is a true connoisseur of Defi and Blockchain technologies, who left his job at a “Big 4” multinational finance firm to pursue crypto and NFT trading full-time. He has a strong background in finance, with MBA from a prestigious B-school. He delves deep into these innovative fields, unraveling their intricacies. Uncovering hidden gems, be it coins, tokens or NFTs, is his expertise. NFTs drive deep interest for him, and his creative analysis of NFTs opens up engaging narratives. He strives to bring decentralized digital assets accessible to the masses.


