
 Home
Home News
News
- 1 Render price (RNDR) is up by 0.90% in the past 24 hours and is currently trading at $1.71.
- 2 Render (RNDR) price failed to sustain above 200 EMA on the daily chart which led to slippage below the nearest support.
Render price has been currently in a short-term correction phase after a surge of nearly 90% from January 2023 to May 2023. The short-term hike in the price led to a profit booking. The investors turned profit bookers led halted the momentum and the price declined to enter a correction phase.
Currently, the price is in the correction phase sliding downwards and suffering rejection from an upper trendline. The token has a trading volume of $13.93 Million with a decline of 16.87% over the past 24 hours. The current volume-to-market cap ratio is 4.26 indicating low volatility at the current moment.

Render Token (RNDR) is an ERC-20 token that artists use to get GPU power from node operators. RNDR uses a mix of manual and automatic proof of render to check that the art is done before paying and releasing it. RNDR also uses Ethereum’s security to hash and send assets in parts to nodes for rendering.
Render Price Failed to Sustain Above 200 EAM On the Daily Chart
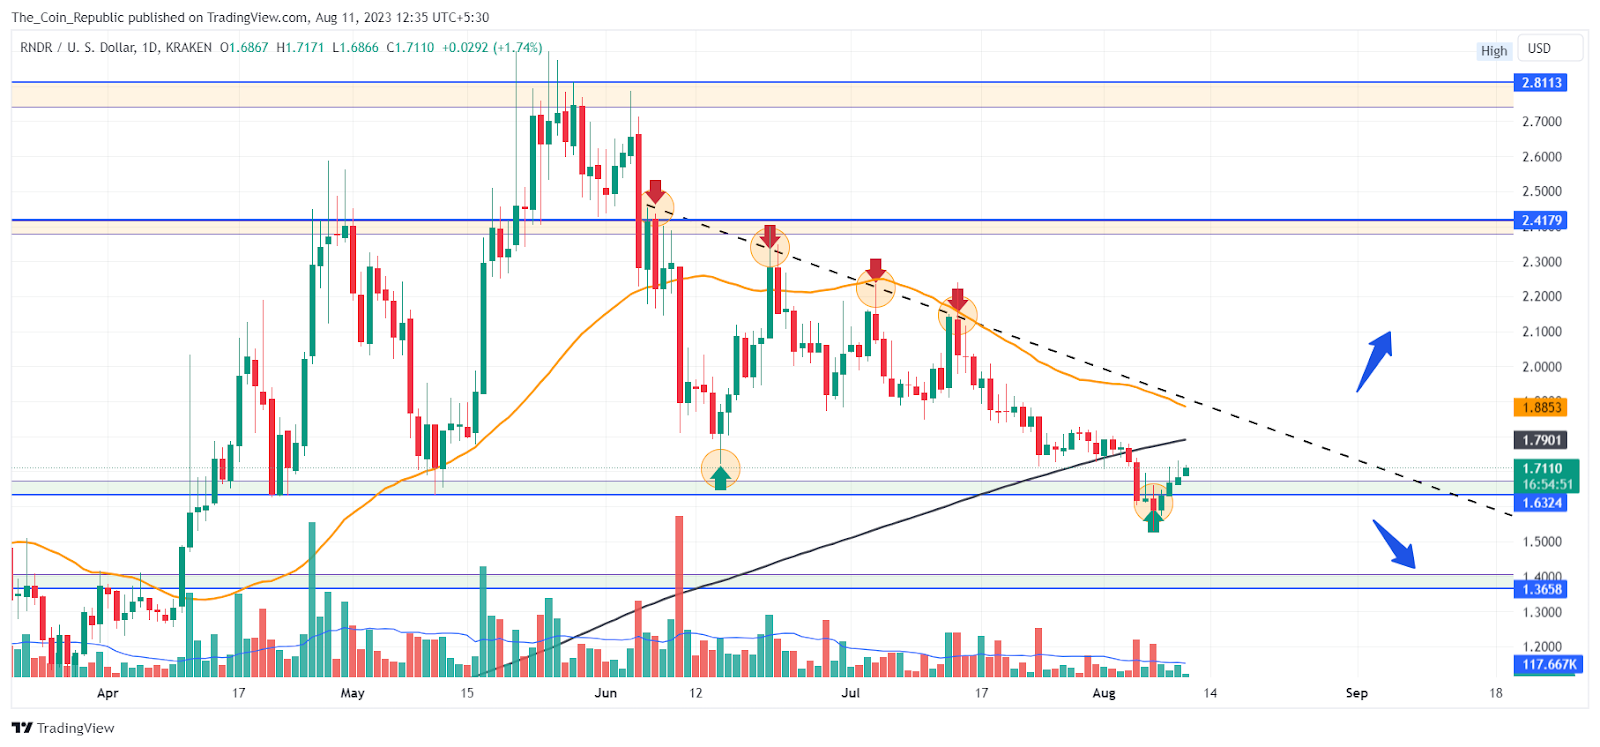
The short term outlook for the RNDR price stays neutral to bearish as the price trades below the upper trendline resistance. Analysts say that the price failed to sustain above 200 EMA on the daily chart showing weakness in the market at the current moment.
The long-term outlook still stays on the neutral side as the price still trades above the previous breakout zone.
Technical Indicators showing weakness in RNDR Coin
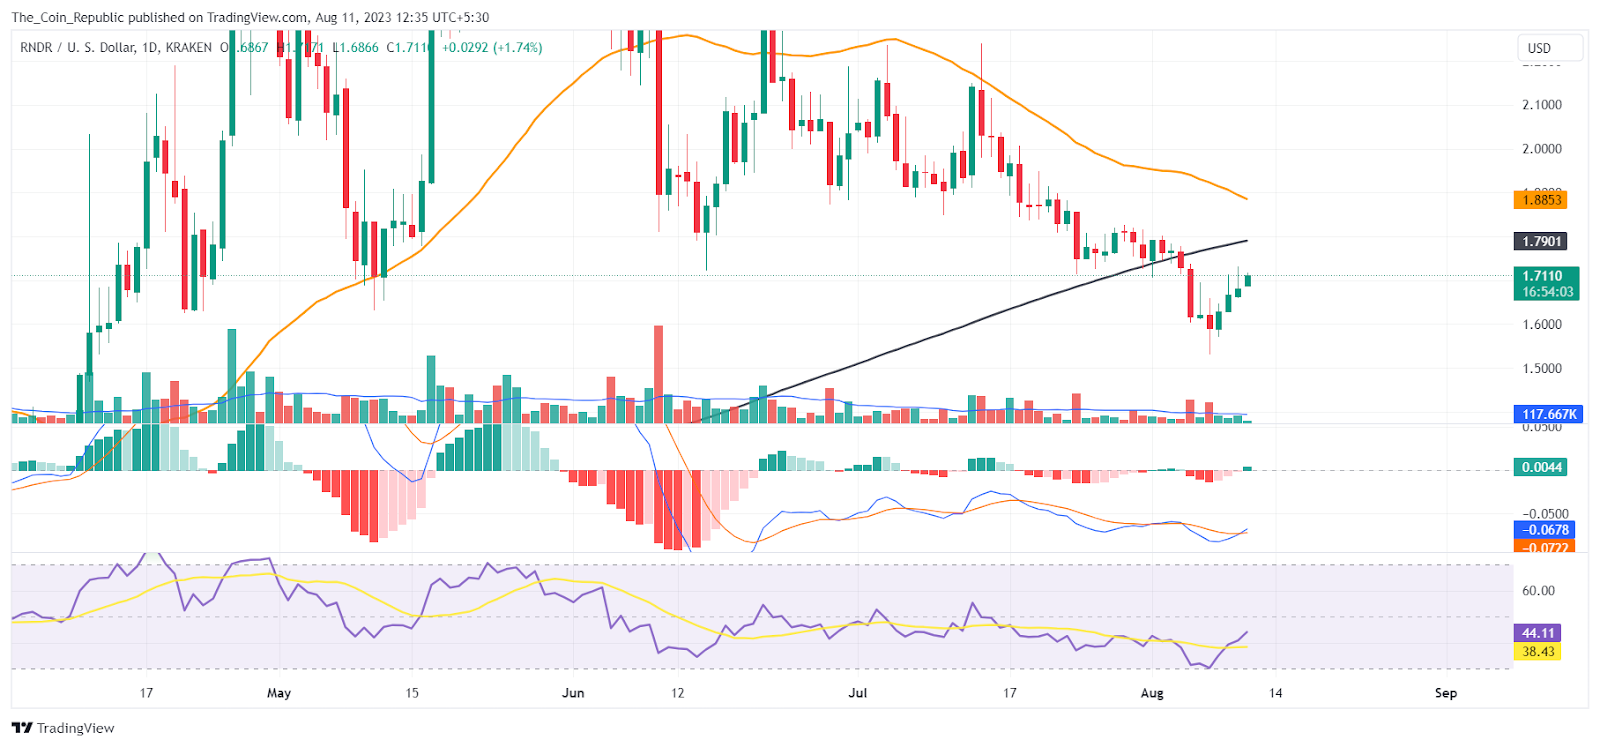
MACD lines have made a bullish crossover. However, histogram bars are being formed above the mean line showing a neutral to bullish sentiment in the market.
The EMA Analysis shows that the RNDR price failed to sustain above the 200 EMA indicating a weakness in the short term.
At the time of publishing, the RSI value of the RNDR token is 43.30 and that of the SMA line is 38.37. RSI has made a breakout of the SMA line indicating the price might be bullish in the upcoming days.
Conclusion
Render price prediction concludes that the price is in a short-term correction after rising 90% from January to May 2023. The price faces resistance from an upper trendline and is below 200 EMA, showing weakness. The long-term outlook is neutral as the price is above the previous breakout zone. The RSI has broken above the SMA line, suggesting a possible bullish reversal.
Technical Levels
- Support levels: $1.632 and $1.365.
- Resistance levels: $2.41 and $2.81.
Disclaimer
The views and opinions stated by the author, or any people named in this article, are for informational purposes only and do not establish financial, investment, or other advice. Investing in or trading crypto or stock comes with a risk of financial loss.

Andrew is a blockchain developer who developed his interest in cryptocurrencies while pursuing his post-graduation major in blockchain development. He is a keen observer of details and shares his passion for writing, along with coding. His backend knowledge about blockchain helps him give a unique perspective to his writing skills, and a reliable craft at explaining the concepts such as blockchain programming, languages and token minting. He also frequently shares technical details and performance indicators of ICOs and IDOs.


