
 Home
Home News
News

- 1 Polkadot crypto price decreased by -0.20% over the past seven days.
- 2 DOT (USD: DOT) crypto price is currently trading at $5.25 with a drop of 0.20% in the last 24 hours.
- 3 DOT has a current market cap of $6.25 Billion.
Polkadot is making a lower-low structure and showcasing bearish momentum. However, By evaluating the price data of the Polkadot crypto, it can be said that it is in a downtrend presently. From its 52-week peak price of $54.98, it decreased to a $5.25 price showing a long bullish trend.
Crypto has had a poor performance over the year. Since the beginning of the year, it gave positive returns of 15.78%. However, the return gets reduced later on. It gave a negative return of -6.03% in the span of 6 months. In the last 1 month, it gave a negative return of -8.44% and -0.20% in the last seven days. Indicating a long Bearish trend.

Polkadot ( USD: DOT) has seen its crypto price Drop in the few past months. At the time of writing, DOT crypto is trading at $4.99 and has been trying to pull back from the current level.
If it can keep this level, the Polkadot price could continue to go up and reach the first and second targets of $5.57 and $6.04. However, if the DOT price cannot maintain this level and falls, then it might hit the closest support levels of $4.81 and $4.52
However, if selling volume adds up then the price might conquer supporting SMA’s by making lower highs and lows. Hence, the DOT price is expected to move downwards giving bearish views over the daily time frame chart.
Technical Analysis of Polkadot Crypto
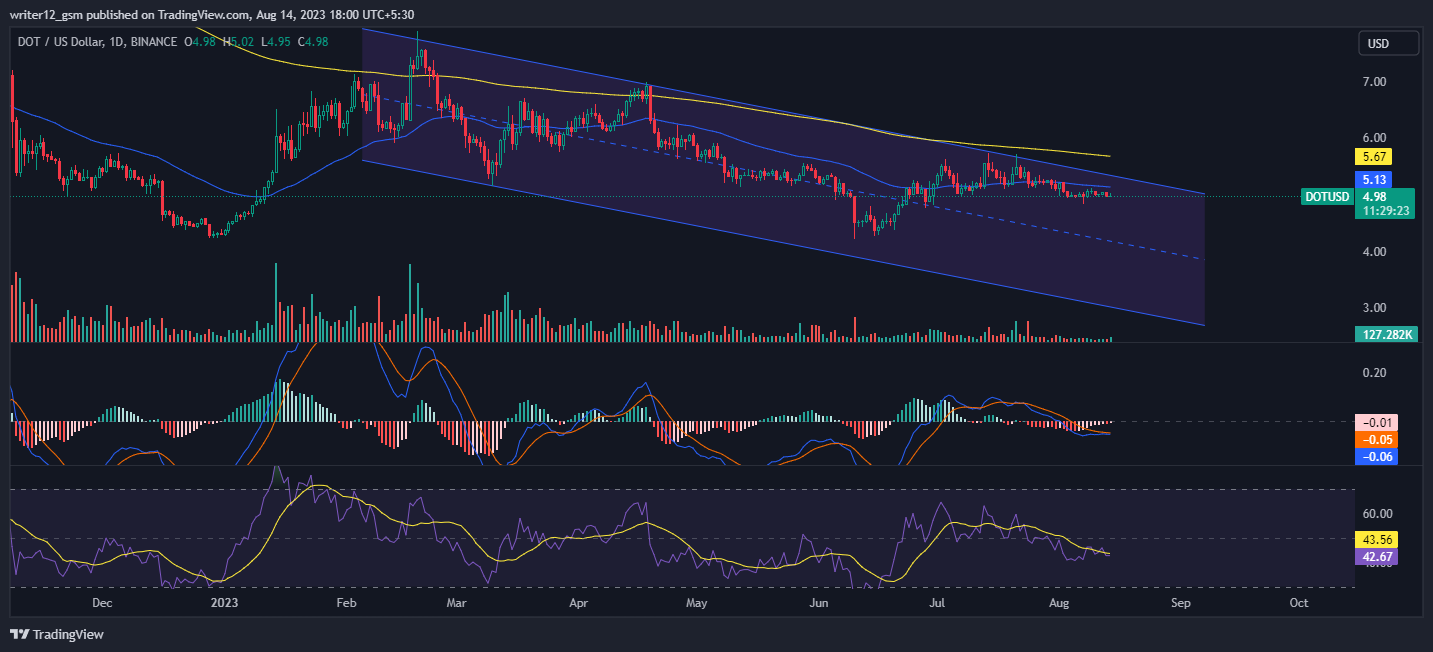
At the time of publishing, Polkadot crypto (USD: DOT) is trading below the 50 and 200-day SMAs (Simple moving averages), which are indicating a downtrend trend.
The current value of RSI is 42.67 points. The 14 SMA is above the median line at 43.56 points which indicates that the Polkadot crypto is bearish.
The MACD line at -0.06 and the signal line at 9.35 are below the zero line. A bearish crossover is observed in the MACD indicator which signals more bearishness for the DOT crypto price.
Summary
Polkadot Price action suggests that the investors and traders are bearish on the 1-D time frame. The price action reflects a bearish outlook at the moment. Polkadot (USD: DOT) technical indicator also reinforces the downtrend. The MACD, RSI, and EMA are highlighting unfavorable signals and indicate that the negative may continue in the DOT crypto price.
Technical Levels
- Support Levels: The nearest support levels for the Polkadot crypto price are S1 $4.81 and S2 $4.52
- Resistance levels: The nearest resistance levels for the DOT crypto price are R2 $5.57 and R2 $6.04
Disclaimer
The analysis provided in this article is for informational and educational purposes only. Do not rely on this information as financial, investment, or trading advice. Investing and trading in crypto involves risk. Please assess your situation and risk tolerance before making any investment decisions.
Steve Anderson is an Australian crypto enthusiast. He is a specialist in management and trading for over 5 years. Steve has worked as a crypto trader, he loves learning about decentralisation, understanding the true potential of the blockchain.


