
 Home
Home News
News
- 1 Yearn Finance price trades at $6310 with a gain of 1.07% during the intraday session.
- 2 YFI price has dipped below 20, 50, 100, and 200-day exponential moving averages.
- 3 The year-to-date return of Yearn Finance is 23.91% while the three-month return is -8.50%.
As soon as the bullish rally for Yearn Finance (YFI) price ended, it entered into a downtrend and started to form lower lows. The bullish rally was initiated during mid-June 2023 after the price formed support at $5380.

The cryptocurrency price made a high of $7488 and faced strong rejection from the 200-day EMA which induced bearish momentum. The downward momentum helped the price in breaking the bullish trend line. After breaking, YFI’s price formed support at $6460 and commenced a rally to rise above $7000.

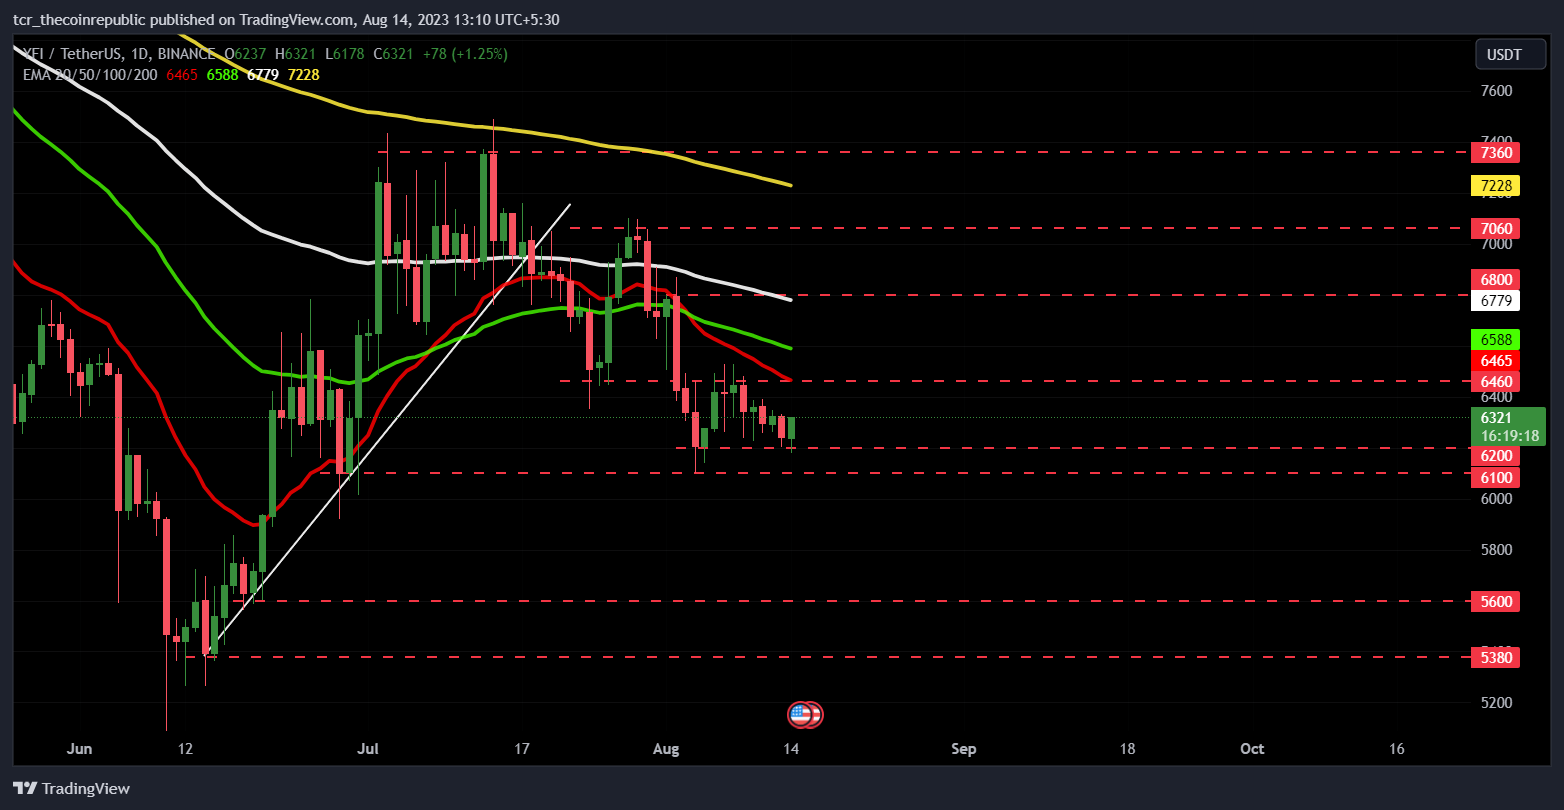
Yearn Finance price did rise but could not sustain above $7000 and broke the recent support level of $6460. Recently, Yearn Finance price entered into a narrow consolidation zone ranging between $6200 and $6460.
Possibilities For Yearn Finance Price
If bulls take control and push the price above the support-turned-resistance level of $6460, there is a possibility that the price might head toward the next resistance level of $6800, causing a rise of roughly 5.29%.
On the other hand, if the price can melt below $6100, there is the possibility that the price might fall to the next support level of $5600. Traders should wait for the candle to close above or below these levels for slight confirmation regarding the move.
The total value locked of YFI has declined significantly since May 2023. The TVL during May 6 2023 was around $477 Million which has now declined to $408.67 Million.
The market capitalization of Yearn Finance has increased by 0.76% to $208,090,762. The 24-hour trading volume has decreased by 0.17%. The price is down by 93.26% from the all-time high of $93,435 and up by 751.88% from the all-time low of $739.44.
Will YFI Price Sustain Above $6300?

The cryptocurrency price has melted below 20,50,100 and the 200-day exponential moving average indicates bearish momentum. Chaikin money flow (CMF) score is still striving to rise above the 0 mark and currently trades at -0.01. However, CMF has witnessed a surge since 4 August 2023, rising from -0.19 to -0.01 implying a rise in capital inflow.
The relative strength index is 42.37 showing that there is a confluence of bears over the price. The Bollinger bands have started to expand indicating a rise in volatility. The long/short ratio is 0.93 with 48.2% longs and 51.8% shorts indicating increased participation of bears in the market in the last 24 hours.
Conclusion
The current market structure shows that there is a strong presence of bears in the market. If bearish momentum prevails, the price might face rejection from the 20-day SMA of Bollinger and head further down.
Technical Levels
- Major support: $5600 and $6100
- Major resistance: $6800 and $7060
Disclaimer
The views and opinions stated by the author, or any people named in this article, are for informational purposes only. They do not establish financial, investment, or other advice. Investing in or trading crypto assets comes with a risk of financial loss.

Adarsh Singh is a true connoisseur of Defi and Blockchain technologies, who left his job at a “Big 4” multinational finance firm to pursue crypto and NFT trading full-time. He has a strong background in finance, with MBA from a prestigious B-school. He delves deep into these innovative fields, unraveling their intricacies. Uncovering hidden gems, be it coins, tokens or NFTs, is his expertise. NFTs drive deep interest for him, and his creative analysis of NFTs opens up engaging narratives. He strives to bring decentralized digital assets accessible to the masses.


