
 Home
Home News
News

- 1 ETH price struggles in a narrow range facing pressure in the past sessions.
- 2 Buyers are unwinding the gains and dragging the momentum.
Ethereum is worrying investors. A major fall will soon be witnessed toward the round mark of $1000, followed by $900. The chart showcases bearishness and double top formation near $2000, and the price is struggling near the lower trendline of the symmetrical triangle pattern. This technical formation indicates that the ETH price is ready for a correction, and sellers are engaging in short buildup activity noted on the charts.

From the start of 2023, ETH price showed accumulation, revamped from the support region of $1000, and showed a significant runaway. At now, the technical sentiments are signalling that ETH is looking to cool off the gains and looking for a retracement now. Moreover, the trading volume shows strong seller participation for the last session, and buyers are starting to unwind their positions and are in fear.

The ETH price failed to break out of $2000, and since then, there has been a steady decline. Furthermore, the ETH price is trading near the 100-day EMA and close to the major trendline, which, if it breaks, will lead to a major correction in the following sessions.
At press time, ETH price is trading at $1841 with an intraday drop of 0.27% showing selling pressure on the charts. Moreover, the trading volume increased by 1.66% to $4.95 Billion. The pair of ETH/BTC is at 0.0627 BTC, and the market cap is $224.75 Billion. Moreover, analysts’ sell rating suggests a downfall toward $1000, followed by strong support of $900.
ETH Signals a Reversal Toward $900 On Daily Charts

ETH price is hovering in a narrow range on the daily charts, indicating a weak chart structure and signaling a correction in the following sessions. Moreover, the price is near the major trendline and the 200-day EMA, which, if it breaks, would lead to a revisit of the demand zone at $900. Moreover, key indicators initiated a sell signal which paused near the lower bollinger band waiting for a breakdown.
Ethereum (ETH) Short Term Chart Shows Negative Outlook
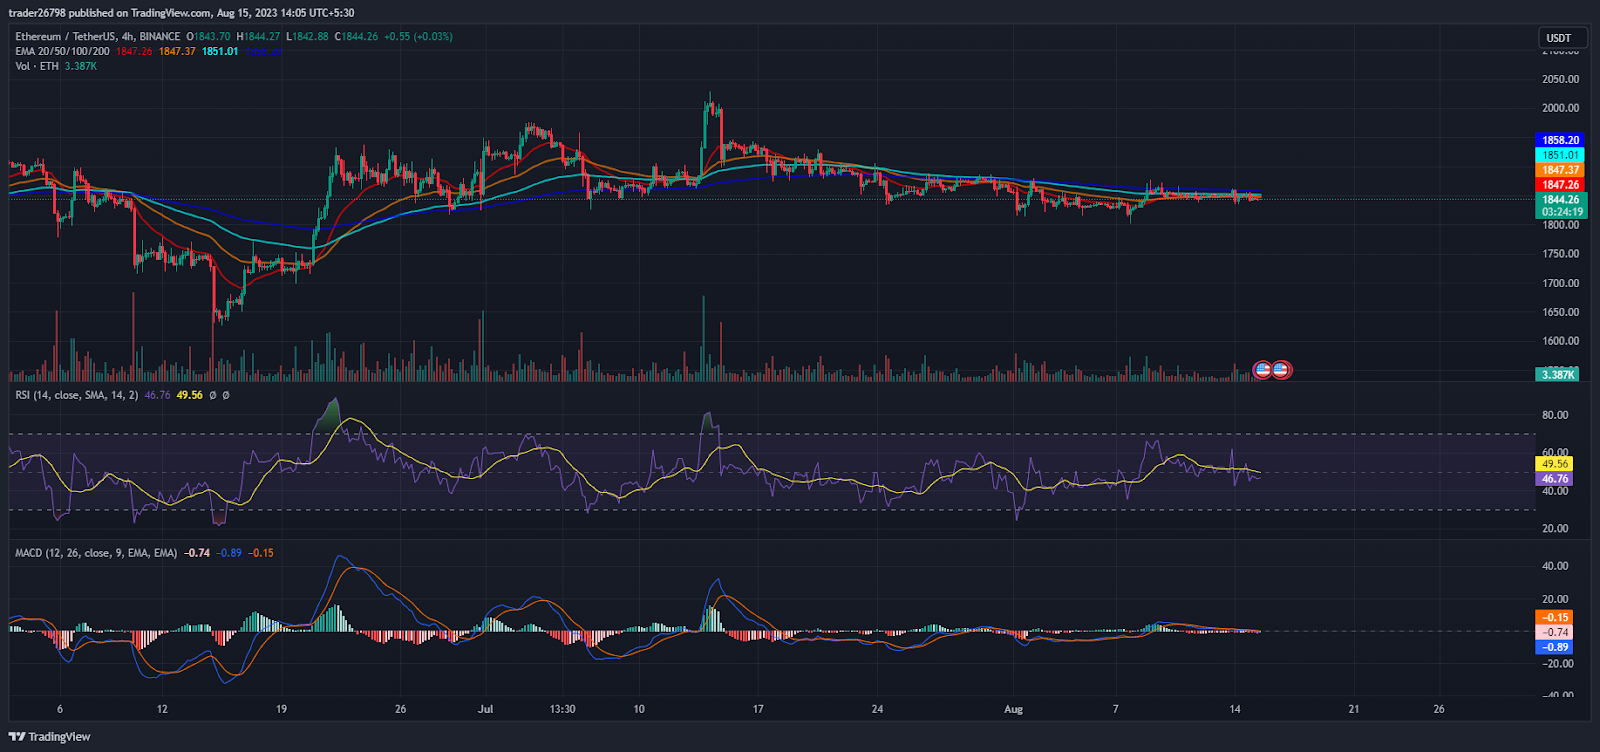
On the 4-hour charts, ETH price suggests a negative outlook with $900 being the likely target.
The RSI curve stayed near neutrality and showed a bearish divergence indicating a selling signal for the upcoming sessions. Moreover, the charts favour the bears, and buyers are looking in trouble now.
The MACD indicator showed convergence of moving averages; the MA line stuck with the signal line indicates consolidation. However, it also signals that the ETH price might face a significant correction toward $900 in the upcoming sessions.
Conclusion:
Ethereum (ETH) price is hovering near the cluster of $1800, close to the 200-day EMA, which sellers are preparing to smash in the upcoming sessions. The technicals are giving a sell signal, as the buyers started laying off the gains, confirming that sellers were looking to win the battle and came into action.
Technical Levels:
Support Levels: $1200 and $900
Resistance Levels: $2000 and $2200
Disclaimer
The views and opinions stated by the author, or any people named in this article, are for informational purposes only and do not establish financial, investment, or other advice. Investing in or trading crypto assets comes with a risk of financial loss.

Andrew is a blockchain developer who developed his interest in cryptocurrencies while pursuing his post-graduation major in blockchain development. He is a keen observer of details and shares his passion for writing, along with coding. His backend knowledge about blockchain helps him give a unique perspective to his writing skills, and a reliable craft at explaining the concepts such as blockchain programming, languages and token minting. He also frequently shares technical details and performance indicators of ICOs and IDOs.


