
 Home
Home News
News
- 1 Thorchain price currently trades at $1.592 while witnessing a gain of 8.09% during the intraday session.
- 2 Thor chain price has been printing bullish candles since 6 August.
- 3 Rune price has surged roughly 72% from the low of $0.93.
Rune price has been bullish since the mid of June, but the rally was halted as the price crossed the $1 level and started to retrace. The cryptocurrency price formed support at $0.92 after melting down and reinitiated a bullish rally to break the major psychological level of $1.
Thorchain price is currently in strong bullish momentum and is headed toward the next resistance level of $1.70. If the bullish momentum continues at the current pace, it will soon break the annual high of $1.972.
Santiment, a behavioral analytics platform, states that the surge was fueled by the increase in social volume by 4,300% between August 7 and August 13. This drove significant attention toward the cross-chain liquidity pool.
Network Activity of Thorchain
The total value locked of Thorchain has also surged from $162.82 Million on August 1 to $259.45 Million. The previous month’s volume was nearly $1.163 Billion and the current volume in the middle of August reached to $1.019 Billion.
The market capitalization of Rune has spiked by 14.25% to $540,963,695. However, the 24-hour trading volume has decreased by 4.28% at the time of writing. The price is down -92.55% from the all-time high of $21.26 and up 19858% from the all-time low of $0.007939.
If the price is successful in breaking the resistance level of $1.70, it might head toward the $1.95 level. The year-to-date return of Thorchain is 24 .65% while the six-month return is -12.36%.
Will Rune Price Reach $2 In August?
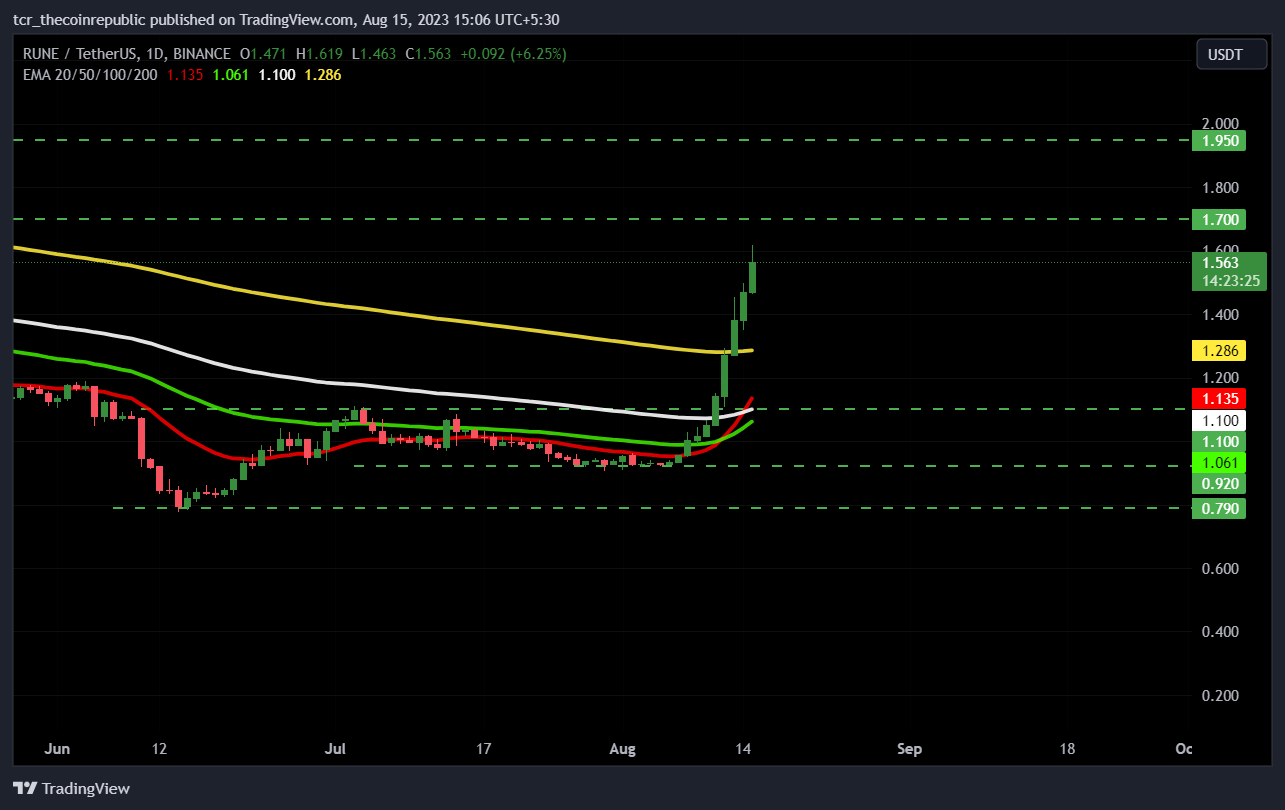
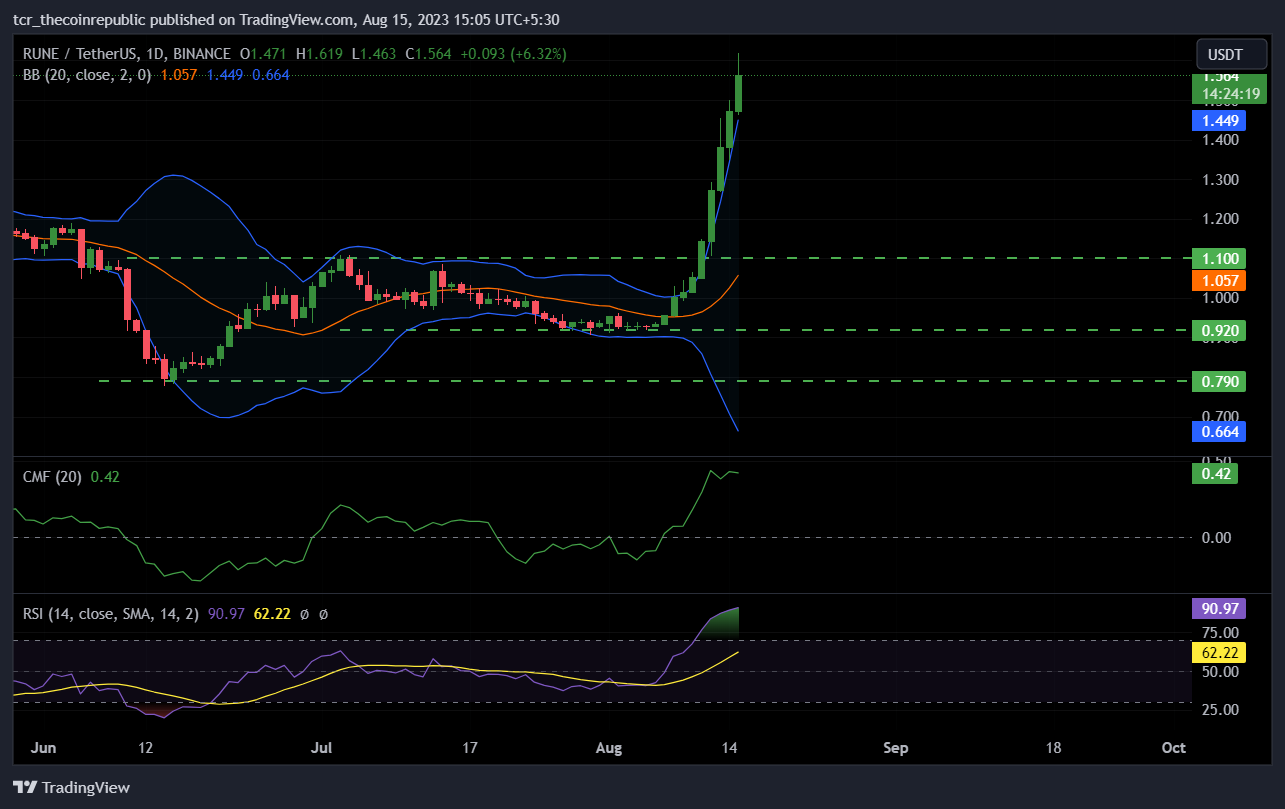
The cryptocurrency price has surged above 20, 50, 100, and 200-day exponential moving averages, implying bullish momentum. Chaikin money flow score is 0.44 indicating that price is strongly bullish and there is increased capital inflow in the market. During the start of August, it was trading below the 0 mark.
The relative strength index has entered into an overbought zone and has been hovering in it since 11 August. RSI trades at 91.16 suggesting a strong possibility of a short-term pullback in the upcoming days.
The Bollinger bands have expanded indicating high volatility in the market and the possibility of big moves. Rune price has been trading above the upper band of Bollinger since the start of the bullish rally which also indicates the possibility of short-term pullback toward the 20-day SMA of Bollinger.
The long/short ratio is 1.05 with 51.35% longs and 48.65% shorts suggesting increased participation of buyers in the last 24 hours.
Conclusion
The market structure and price action of Rune is highly bullish and there are currently no signs of bearishness in the market.
Technical levels
Major support: $0.92 and $0.79
Major resistance:$1.70 and $1.95
Disclaimer
The views and opinions stated by the author, or any people named in this article, are for informational purposes only. They do not establish financial, investment, or other advice. Investing in or trading crypto assets comes with a risk of financial loss.
Mr. Pratik chadhokar is an Indian Forex, Cryptocurrencies and Financial Market Advisor and analyst with a background in IT and Financial market Strategist. He specialises in market strategies and technical analysis and has spent over a year as a financial markets contributor and observer. He possesses strong technical analytical skills and is well known for his entertaining and informative analysis of the Financial markets.


