
 Home
Home News
News
- 1 LUMN stock heads for the demand zone at $1.18 under strong selling pressure.
- 2 LUMN sellers have gained momentum and look aggressive in the past sessions.
LUMN stock price faced difficulty in surpassing the $2.19 resistance point and remains confined beneath it. Currently, LUMN shares require an influx of buyers to drive an upward movement toward recovery. Nevertheless, there’s an observed low trading volume. Simultaneously, LUMN shares have descended beneath the 50, 100, and 200-day daily moving averages.
LUMN stock price fell 0.59% last week, It declined by 18.36% throughout the month. Furthermore, Lumen Technologies shares experienced a drop of roughly 56.22% within the past six months and a decrease of 84.88% since last year.

Additionally, the Lumen Technologies share price shed 68.11% year to date. These trends collectively indicate the challenges faced by LUMN shares in their recovery efforts throughout the year.
Technical indicators in LUMN share suggest the downside trend of LUMN stock price. Relative strength index and the moving average convergence divergence both indicate the slippage in the LUMN share price.
The Lumen price at present requires substantial support from the buyers in order to make a recovery as it is facing major resistance from the previous resistance points and multiple moving averages. Buyers are pulling the price action into their grasp, according to the candlestick patterns.
The price may soon attempt to make a bullish recovery. However, as it is trading below the key EMA levels, the buyers will have to face multiple resistance levels in order to attain the target. Buyers are presently making sustained efforts to reverse the trend.
On the daily charts, LUMN stock shows sellers’ dominance as it slipped below neutrality. The price dropped below the 50.00% Fib level, heading toward the 23.6% Fib level and near the lower Bollinger band.
Overall, the technical indicators and price action suggest that LUMN stock is bearish and that the downtrend might continue.
Technical Overview of LUMN Stock
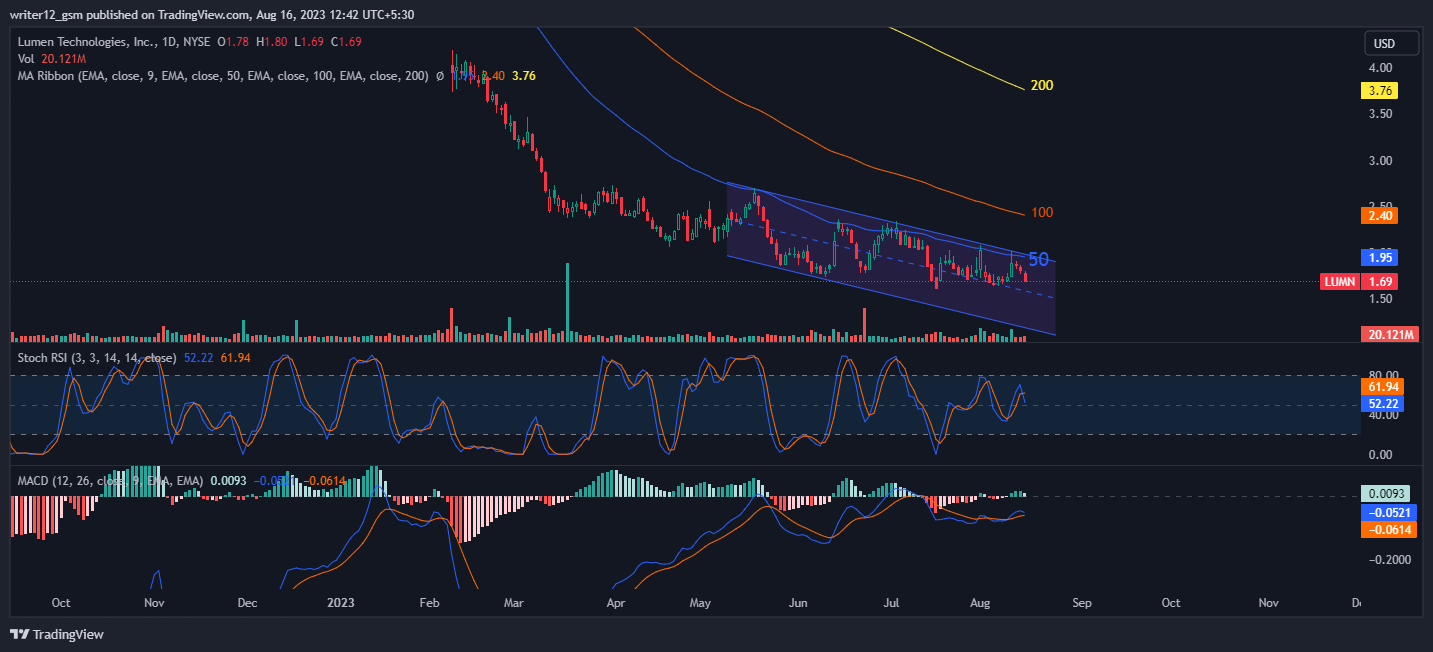
At the moment, LUMN stock (NASDAQ: Lumen Technologies) is trading below the 50, 100, and 200-day exponential moving averages, which are supporting the price trend.
The current value of RSI is 43.15 points. The 14 SMA is above the median line at 45.11 points which indicates that the LUMN stock is bearish.
The MACD line at -0.0521 and the signal line at -0.0614 are below the zero line. A bearish crossover is observed in the MACD indicator which signals more bearishness for the Lumen Technologies stock price.
Summary
LUMN price action indicates that the investors and traders are bearish on the 1-D and weekly time frames. The price action reflects a bearish perspective presently. Technical indicators also highlight the bearish trend. The MACD, RSI, and EMA are highlighting adverse indications and suggest that the downtrend may resume in the Lumen Technologies stock price.
Technical Levels
- Support Levels: Nearest support levels are $1.49 and $1.18
- Resistance levels: Nearest resistance levels are $2.22 and $2.64.
Disclaimer
The analysis provided in this article is for informational and educational purposes only. Do not rely on this information as financial, investment, or trading advice. Investing and trading in stock involves risk. Please assess your situation and risk tolerance before making any investment decisions.

With a background in journalism, Ritika Sharma has worked with many reputed media firms focusing on general news such as politics and crime. She joined The Coin Republic as a reporter for crypto, and found a great passion for cryptocurrency, Web3, NFTs and other digital assets. She spends a lot of time researching and delving deeper into these concepts around the clock, and is a strong advocate for women in STEM.


