


RUNE is making a Higher high structure and maintaining its momentum. However, the price data shows that it is in a strong uptrend.
The RUNE crypto chart shows the tables have turned on the bears. However, it gave impressive returns to its investors in a short span of time. Current market sentiments are very positive about crypto. It gave 27.03% returns year to date and an excellent return of 35.13% in a span of 3 months. Last month was like a goldmine to its investors, giving more than 59% returns; and 60% returns in a single week.
On Wednesday, August 16th, 2023, Rune crypto opened at $1.5492923 and close at 1.6105356. RUNEUSD made a high of 1.6708978 and a low of $1.5350653.
However, if buying volume increases, then the price might support bullish momentum by making higher highs and make new highs. Hence, the RUNE price is expected to move upward giving bullish views over the daily time frame chart.
Technical Analysis of RUNE Crypto Prin 1-D Timeframe
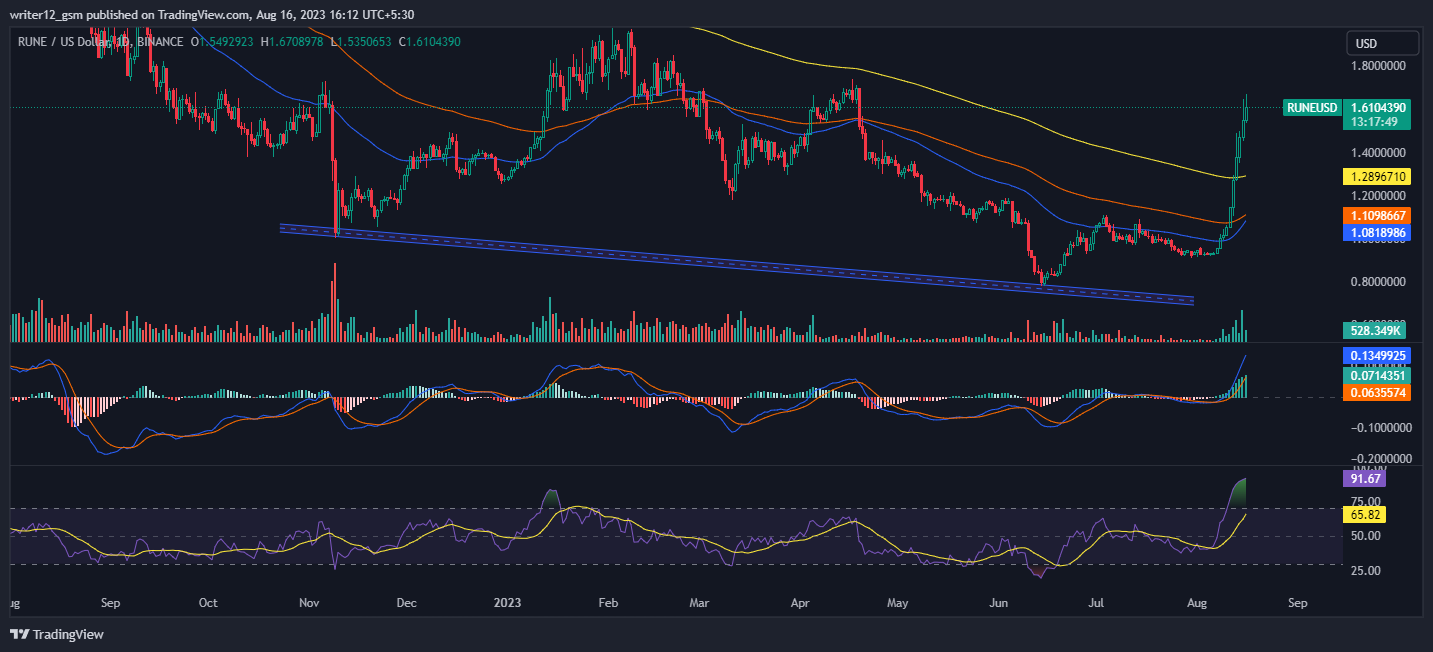
RUNE (USD: RUNE) crypto price rose steadily over the past three months, gaining 34.14% and 58.68% in the last month. Currently, RUNE crypto is trading at $1.6044606 and has been trying to hold on to this level after an unexpected surge in price.
If it can keep this level, RUNE price could continue to go up and reach the first and second targets of $1.0603319 and $1.1853595 respectively. However, if RUNE price cannot maintain this level and it falls, then it might hit the closest support levels of $0.8600699 and $0.7848355.
Currently, RUNE crypto(USD: RUNE) is trading above the 50, 100, and 200-day simple moving averages, which are supporting the price momentum.
The current value of RSI is 91.67 points. The 14-day SMA is above the median line at 65.82 points which indicates that RUNE crypto is bullish.
The MACD line at 0.0714282 and the signal line at 0.0635089 are above the zero line. A bearish crossover is observed in the MACD indicator which signals bullishness in crypto.
Summary
RUNE (USD: RUNE) technical oscillators also support the bullish trend. The MACD, RSI, and EMA are positive. Price action suggests that the investors and traders are bullish on the 1-Day time frame.
Technical Levels
- Support Levels: Nearest support levels are $0.8600699 and $0.7848355.
- Resistance Levels: Nearest resistance levels are $1.0603319 and $1.1853595.





