
 Home
Home News
News
- 1 SLB stock price is currently trading at $58.33 with a drop of 2.00% in the last 24 hours.
- 2 SLB Schlumberger stock price was trading with strong uptrend momentum.
- 3 Schlumberger’s share price has recovered above 20-EMA to reach the 50, 100, and 200-day Daily Moving Average.
The price of SLB stock (NYSE: Schlumberger ) highlights bulls’ dominance and is attempting to reach the round figure of $62. This positive development indicates a potential upward movement for Schlumberger stock, with a projected target of $62. Consequently, buyers are expected to maintain their long positions in the stock.
SLB stock is now trading beyond the key moving averages and is showing signs of bullishness. Additionally, based on the recent trading sessions, the chart structure indicates a favorable preference for buyers.
The stock has gained momentum and is poised for a potential upward move, with a target of reaching $65. The renewed action and increasing traction further support the positive outlook for buyers in the market.
At press time, NSC stock was trading at $58.33 with an intraday loss of 2.00%, showing bullishness and a positive outlook on the charts. Furthermore, the intraday trading volume was 6.04 Million, and the market cap was $82.898 Billion.
However, a spike in buying volume could drive up bullish momentum, producing higher highs and new highs. Hence, the SLB price is expected to move upward, giving bullish views over the daily time frame chart.
Technical Analysis of SLB Stock Price in 1-D Timeframe
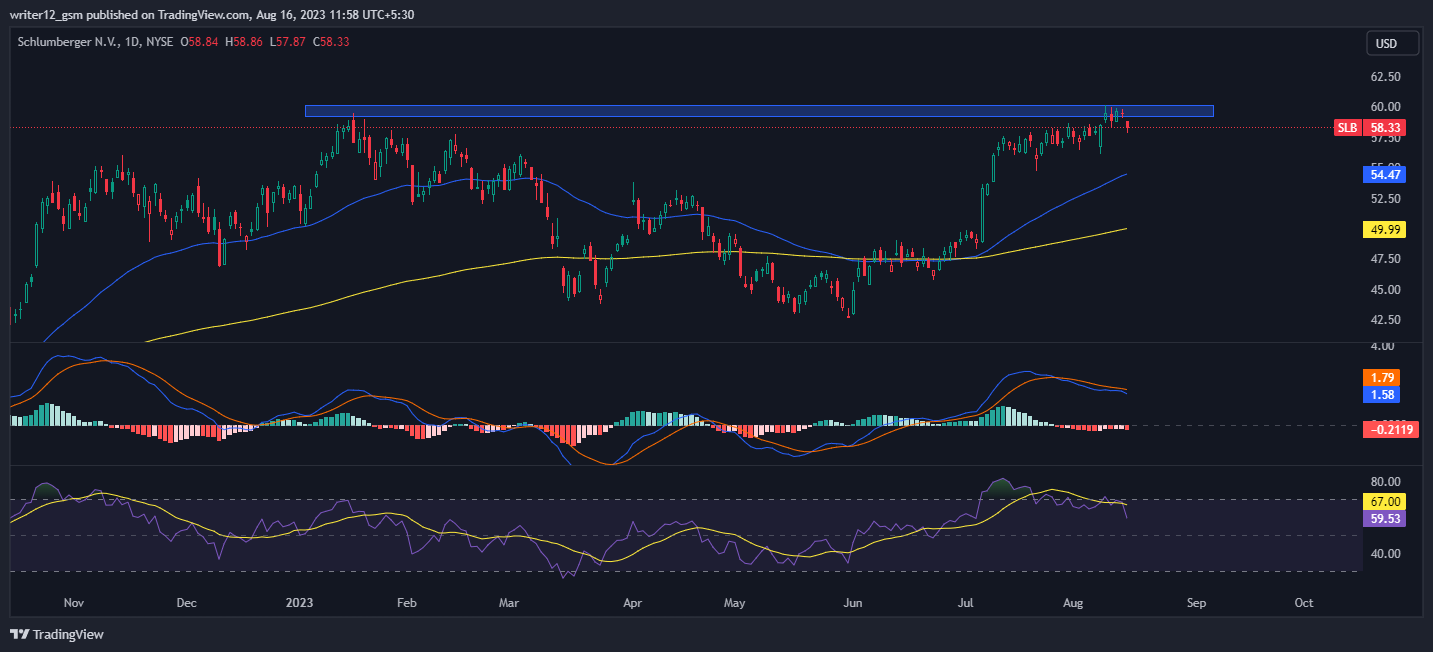
Currently, SLB stock (NYSE: Schlumberger) is trading above the 50 and 200-day simple moving averages, which are supporting the price momentum.
The current value of RSI is 59.53 points. The 14 SMA is above the median line at 67.00 points which indicates that the SLB stock is bullish.
The MACD line at 1.58 and the signal line at 1.79 are above the zero line. A bearish crossover is observed in the MACD which signals weakness in the momentum of the Schlumberger stock price.
Stochastic RSI is near the median level. The %D and %K lines make a negative crossover between them though the 50 RSI zone is yet to be intercepted. The present value of stochastic RSI is 30.12 points.
Analysts’ Take on Schlumberger Stock
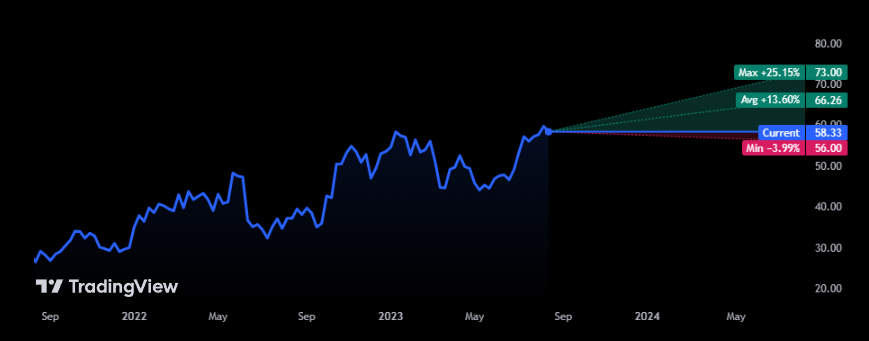
As per TradingView, out of 31 analysts covering SLB stock, 25 are recommending SLB as a ‘Strong Buy,’ 4 are recommending ‘Buy,’ 2 are recommending ‘Hold,’ 0 (0%) are recommending ‘Sell,’ and 0 (0%) are recommending ‘Strong Sell’.
The average Schlumberger stock price target is $66.26, which is 13.60% higher than the current price of $58.33. The highest Schlumberger stock price target is $73.00, while the lowest SLB stock price target is $56.00.
Summary
SLB (NYSE: Schlumberger) technical oscillators also support the bullish trend. The MACD, RSI, and EMA are emphasizing positive signs and imply that the uptrend may continue in the Schlumberger stock price. Investors and traders are bullish on the 1-Day time frame. The price action reflects a bullish perspective at the moment.
Technical Levels
- Support Levels: $51.54 and $44.73.
- Resistance Levels: $61.92 and $61.92.
Disclaimer
The analysis provided in this article is for informational and educational purposes only. Do not rely on this information as financial, investment, or trading advice. Investing and trading in stock involves risk. Please assess your situation and risk tolerance before making any investment decisions.
Steve Anderson is an Australian crypto enthusiast. He is a specialist in management and trading for over 5 years. Steve has worked as a crypto trader, he loves learning about decentralisation, understanding the true potential of the blockchain.


