
 Home
Home News
News
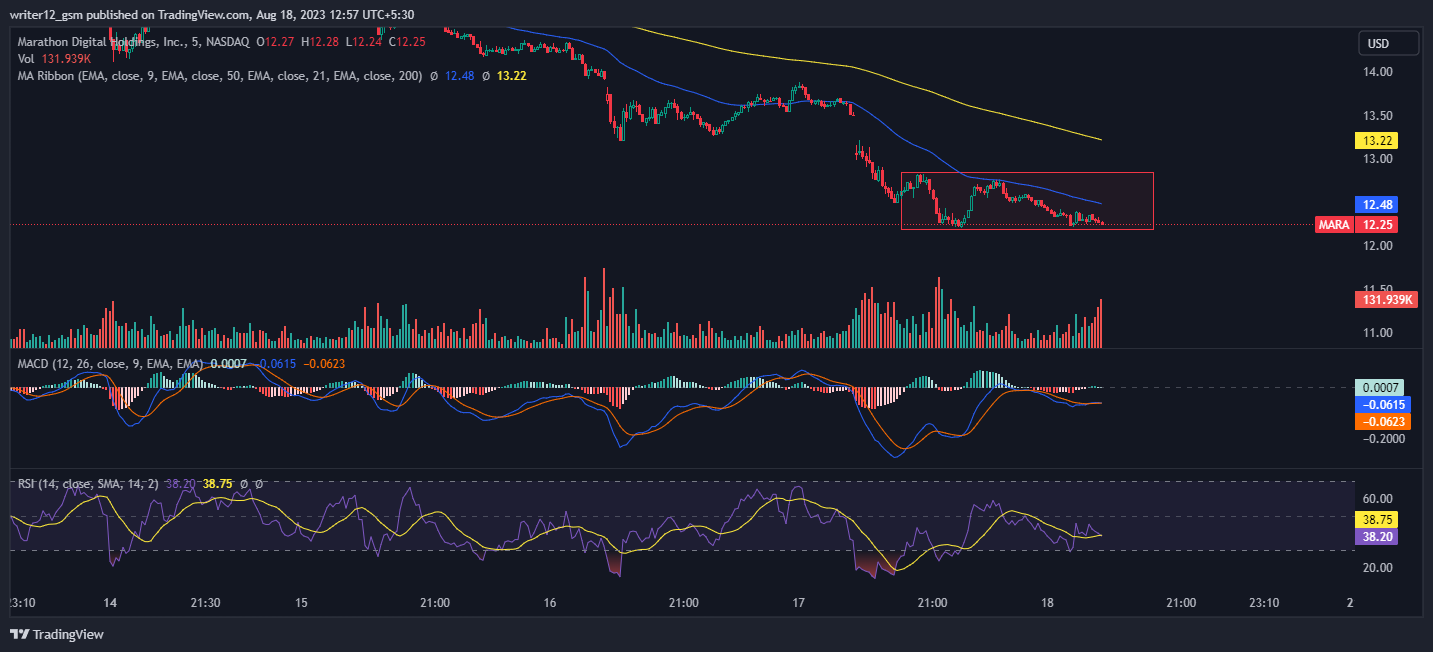
- 1 Marathon stock price was $12.25 with a drop of 9.26 % in the last 24 hours and a market cap of $2.135 Billion.
- 2 Sellers are gaining momentum; were aggressive in the past few sessions.
Marathon is heading downward by making lower-low structures. It is currently below the 50 EMA at the level of $12.48. However, the main reason behind the downfall of Marathon stock is bearishness in Bitcoin. Moreover, if BTC falls below $25K, then MARA may decrease further. However, analysts speculate that MARA may recover if it remains above the $10 support.
Marathon stock (MARA) was rejected from the 50 EMA, resuming the downtrend that shows further weakness in the market. According to the current situation, the market is trading below the dynamic support trendline which can further lead to lower levels. The market is also in a downtrend based upon a larger time frame as it is making lower lows.

Marathon stock has been declining from its high levels and making lower-low structures. It is currently in a downtrend after trading below the 50-day and 200-day moving averages. If MARA cannot stop the bearish pressure, it may form a new lower low pattern shortly and prolong the downtrend.
The current scenario requires traders and investors to be patient and look for a clear break below or above the range before making any moves and avoid the fear of missing out to minimise losses.
Marathon stock price fell 21.78% last week. It declined by 27.98% through the month. The returns were around 64.43% within the past six months while over the past year, the returns were a whopping 242.18%.
Additionally, the MARA share price has grown by approximately 242.18% year to date. These trends collectively highlight the challenges faced by Marathon shares in their recovery efforts in recent times.
Technical Analysis of Marathon Stock Price in 1-D Timeframe
On the daily charts, Marathon stock shows sellers’ dominance. It slipped below neutrality, showing a negative outlook on the charts. Moreover, the price dropped below the 38.2% Fib level, heading toward the 23.6% Fib level and near the lower Bollinger band
The price of Marathon Stock is currently at a crossroads. It could go up to $20.18 and $22.99 if it can maintain the current level. However, if the price cannot maintain this level and falls, it might hit the closest support levels of $14.26 and $11.14.
At present, Marathon stock (NASDAQ: MARA) is trading below the 50 and 200-day exponential moving averages, which are not supporting the price trend. If bulls want to make a comeback, they will have to rise and sustain above the 20-day EMA. However, the sellers seem to be more aggressive as compared to buyers.
The price of MARA is currently trading near the support levels. If selling pressure increases, the price could break through these levels and move lower. This would be a bearish signal as it would suggest that the trend is reversing.
The current value of RSI is 38.75 points. The 14 SMA is above the median line at 38.20 points which indicates that the Marathon stock is bearish.
The MACD line at -0.0615 and the signal line at -0.0623 are below the zero line. A bearish crossover is observed in the MACD indicator which signals more bearishness for the MARA stock price.
Summary
Marathon stock price is bearish per the chart. The sellers are overpowering on the higher levels. The technical indicators also signal a bearish trend. The MACD, RSI, and EMA are accentuating negative signs and suggest that the downtrend may continue in the MARA stock price. Marathon stock price action suggests that the investors and traders are bearish on the 1-D time frame. The technical analysis suggests that the Marathon stock price is in a bearish grip and the probability of testing the previous highs in the coming months remains low.
Technical Levels
- Support Levels: Nearest support levels are $14.26 and $11.14.
- Resistance Levels: Nearest resistance levels are $20.18 and $22.99.
Disclaimer
The analysis provided in this article is for informational and educational purposes only. Do not rely on this information as financial, investment, or trading advice. Investing and trading in stock involves risk. Please assess your situation and risk tolerance before making any investment decisions.

Andrew is a blockchain developer who developed his interest in cryptocurrencies while pursuing his post-graduation major in blockchain development. He is a keen observer of details and shares his passion for writing, along with coding. His backend knowledge about blockchain helps him give a unique perspective to his writing skills, and a reliable craft at explaining the concepts such as blockchain programming, languages and token minting. He also frequently shares technical details and performance indicators of ICOs and IDOs.


