
 Home
Home News
News
- 1 Verizon Communications stock is currently trading at $33.06 with a drop of 0.63% and a market cap of $138.986 Billion.
- 2 VZ took a rejection from the upper trendline with a strong bearish candle.
VZ is trading at $33.06 with a trading volume of 19.128 Million while the average trading volume of the last 10 days was 19.616 Million. The current market cap of the company is $138.986 Billion with a price-to-earnings ratio of 6.66. The floating share value is 4.203 Billion with an essential EPS of $5.00.
The Q2 2023 earnings of the company gave a revenue of 32.60 Billion and a net income of 4.65 Billion with a profit margin of 14.26%. However, the earnings of the stock were less than the Q1 2023 earnings.
This year, VZ’s performance was poor. Since the beginning of the year, the company gave a negative return of 16.87% to its investors. Also, a weakness in momentum has been observed.
As per TradingView, out of 26 indicators,14 are on the sell side, 9 are on the neutral side, and 3 of them indicate a buy signal. So the overall weightage of indicators is on the sell side.
As per TradingView, 22 analysts gave a maximum estimation of a price of $45.00 and a minimum estimation of a price to be $34.00.
Moreover, out of 27 analysts, 4 are giving a strong buy signal, 1 gave the buy signal while 20 signaled ‘hold’. However, one of them indicated a sell and one strong sell.
VZ Stock Technical Analysis
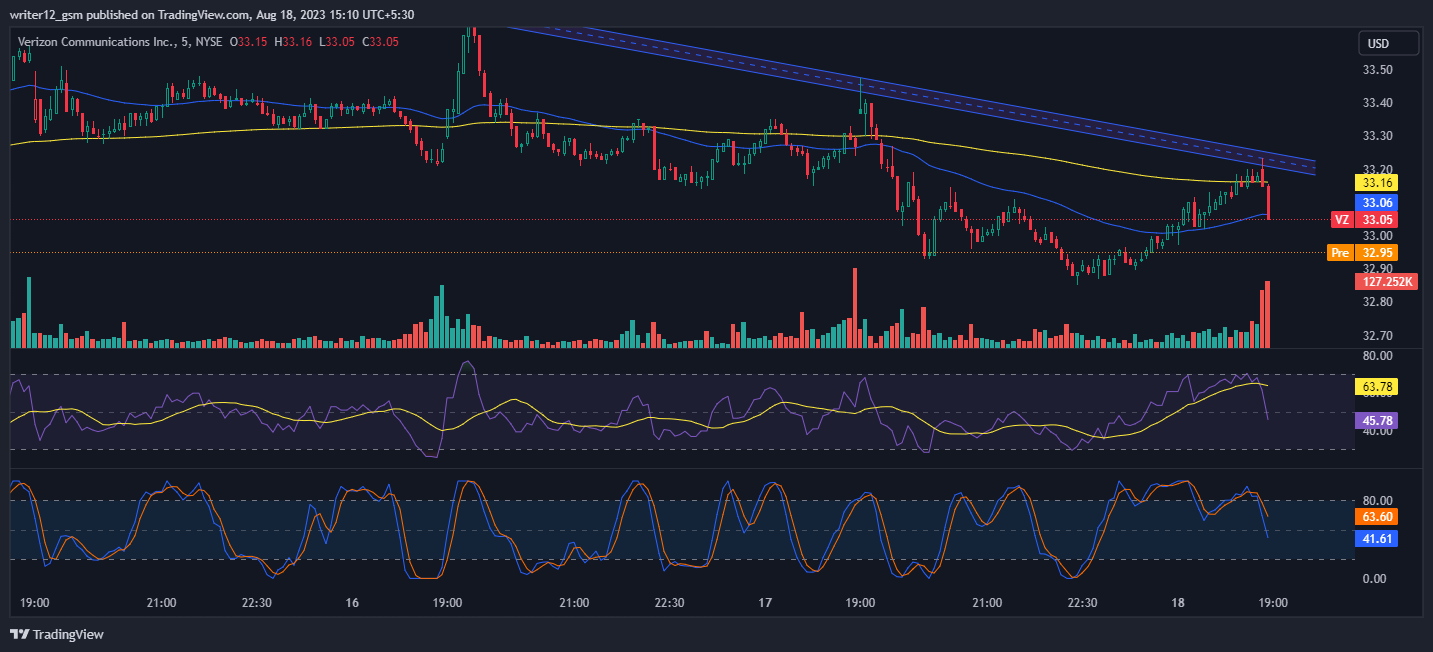
According to the technical chart, VZ took a sharp rejection from the upper trendline of $33.23 and broke the 50 and 200 EMA lines. Moreover, the price was currently below the 50 and 200 EMA line.
MACD is currently in the positive zone but it is headed downwards. MACD line (0.0369) is beneath the signal line (0.0408) demonstrating bearishness in the coming sessions.
The RSI line is also heading towards an oversold zone, breaching the median line. RSI line (45.78) is beneath the 14 SMA (63.78) line demonstrating bearishness.
4 Hours Technical Analysis
On the 4-hour charts, Verizon Communications stock is bearish and is heading downwards. However, buyers are accumulating and defending it from the support.
The RSI curve is floating near 45 showing selling pressure which indicates that the stock is heading toward oversold. This could be a sign that sellers are starting to lose control of the stock. However, the RSI is still in the neutral zone, so it is too early to say for sure that a breakdown is imminent.
The MACD indicator is bearish and is maintaining red bars on the histogram. This suggests that the momentum in the stock is bearish. However, the MACD is not yet in the oversold zone, so it is possible that the stock could stage a rally before breaking down.
Conclusion
Scarcity is created in the stock market to accumulate more investors and creditors. It is better to keep it at arm’s length as this may result in one of the emerging reasons for market volatility. Verizon Communications’ stock price is heading downward breaking 50 EMA and 200 EMA. The MACD and RSI are indicating a downtrend in VZ price.
Technical Support and Resistance Levels
- Support Levels: $30.99 and $27.91
- Resistance Levels:$37.42 and $40.77
Disclaimer
The analysis provided in this article is for informational and educational purposes only. Do not rely on this information as financial, investment, or trading advice. Investing and trading in stock involves risk. Please assess your situation and risk tolerance before making any investment decisions.

Nancy J. Allen is a crypto enthusiast, with a major in macroeconomics and minor in business statistics. She believes that cryptocurrencies inspire people to be their own banks, and step aside from traditional monetary exchange systems. She is also intrigued by blockchain technology and its functioning. She frequently researches, and posts content on the top altcoins, their theoretical working principles and technical price predictions.


