
 Home
Home News
News
- 1 XRP crypto price decreased by 20.31% over the past seven days.
- 2 XRP crypto price is currently trading at $0.50359 with a drop of 0.65% in the last 24 hours.
- 3 XRPUSD has a market cap of $26.614 Billion.
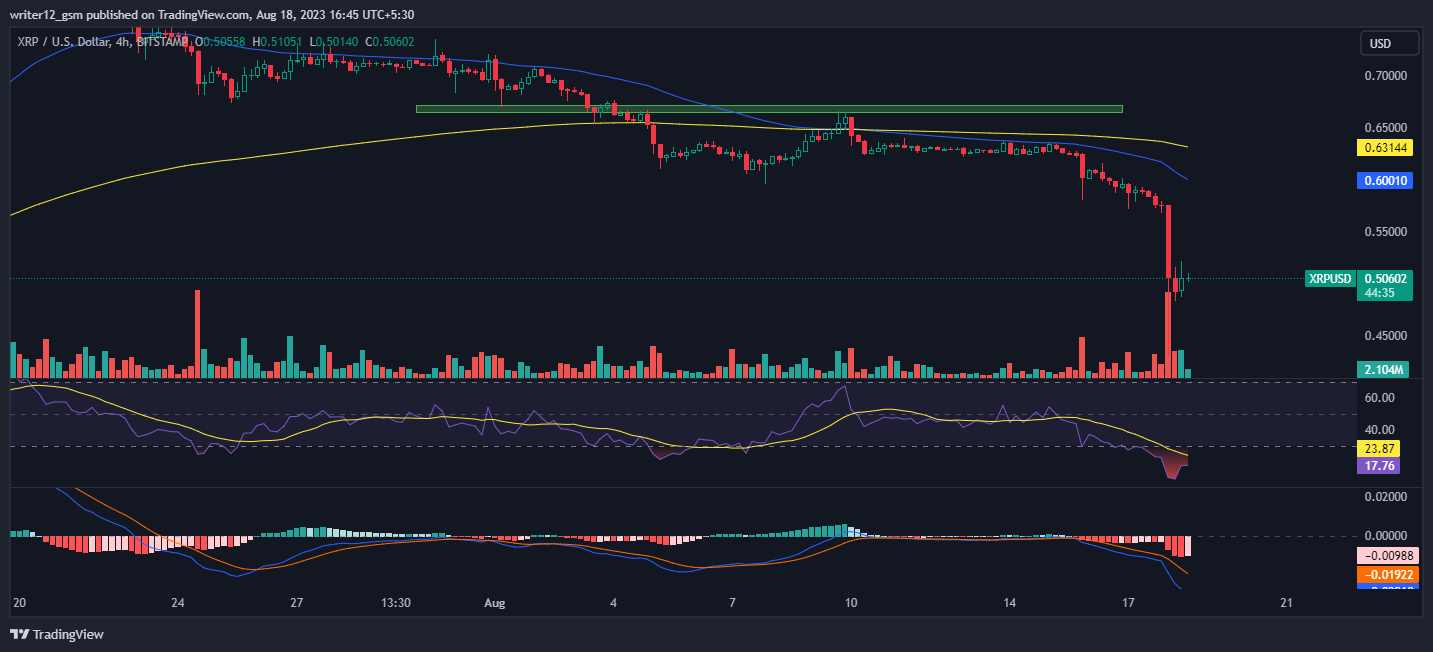
XRP price chart shows a falling knife, having dropped more than 35.07% in a month and 20.13% in a week. However, the XRPUSD has given excellent returns since the beginning of the year (49.10%) while in the 6-month period, it gave 29.05% returns.
Currently, XRP is trading at $0.50859 with 24 hours trading volume of 15.988 Million. The last 10 days’ average volume is 15.86 million. The current market cap of crypto is $26.674 Billion.
XRP is currently seeing a weak bearish momentum on the weekly technical charts. On the daily chart, the asset price shows strong downward momentum. XRP price is currently between the 50, 100, and 200-day EMAs. If the price surges beyond the 200-day EMA, then a strong upside trend could be seen in the future.
The current scenario requires traders and investors to be patient and look for a clear break below or above the range before making any moves and avoid the fear of missing out to minimize losses.
Technical Analysis of XRP Crypto Price in 1-D Timeframe
XRP (USD: XRPUSD) price declined 35.20% over the past month. At the time of writing, XRPUSD crypto is trading at $0.50348 and has been trying to hold on to this level after a major fall.
If it can keep this level, the XRP price could continue to go up and reach the first and second targets of $0.94400 and $1.19099 respectively. However, if the XRPUSD price cannot maintain this level and falls, then it might hit the closest support levels of $0.45400 and $0.21099.
At the time of publishing, XRP crypto (USD: XRPUSD) is trading below the 50 and 200-day exponential moving averages, which are supporting the price trend.
However, if more selling volume adds up, then the price might conquer supporting SMAs by making lower highs and lows. Hence, the XRP USD price is expected to move downwards giving bearish views over the daily time frame chart.
The current value of the RSI is 17.05 points. The 14 SMA is above the median line at 23.82 points which indicates that the XRP crypto is bearish.
The MACD line at -0.02927 and the signal line at -0.02926 are below the zero line. A bearish crossover is observed in the MACD indicator which signals more bearishness for the XRPUSD crypto price.
Summary
XRP price at present requires substantial support from the buyers in order to make a recovery as it is facing major resistance from the previous resistance points and multiple moving average levels. Buyers are pulling the price action into their grasp. The technical oscillators highlight the bearish trend. The MACD, RSI, and EMA are giving negative signs and imply that the downtrend may continue in the XRPUSD crypto price. XRP Price action suggests that the investors and traders are bearish on the 1-D time frame. The price action reflects a bearish perspective at the moment.
Technical Levels
- Support Levels: Nearest support levels are $0.45400 and $0.21099.
- Resistance Levels: Nearest resistance levels are $0.94400 and $1.19099.
Disclaimer
The analysis provided in this article is for informational and educational purposes only. Do not rely on this information as financial, investment, or trading advice. Investing and trading in crypto involves risk. Please assess your situation and risk tolerance before making any investment decisions.

Andrew is a blockchain developer who developed his interest in cryptocurrencies while pursuing his post-graduation major in blockchain development. He is a keen observer of details and shares his passion for writing, along with coding. His backend knowledge about blockchain helps him give a unique perspective to his writing skills, and a reliable craft at explaining the concepts such as blockchain programming, languages and token minting. He also frequently shares technical details and performance indicators of ICOs and IDOs.


