
 Home
Home News
News
- 1 ATOM crypto price fell by 9.10% over the past seven days.
- 2 Cosmos crypto price is currently trading at $7.583 with a drop of 0.04% in the last 24 hours.
- 3 ATOMUSD has a market cap of $2.627 Billion.
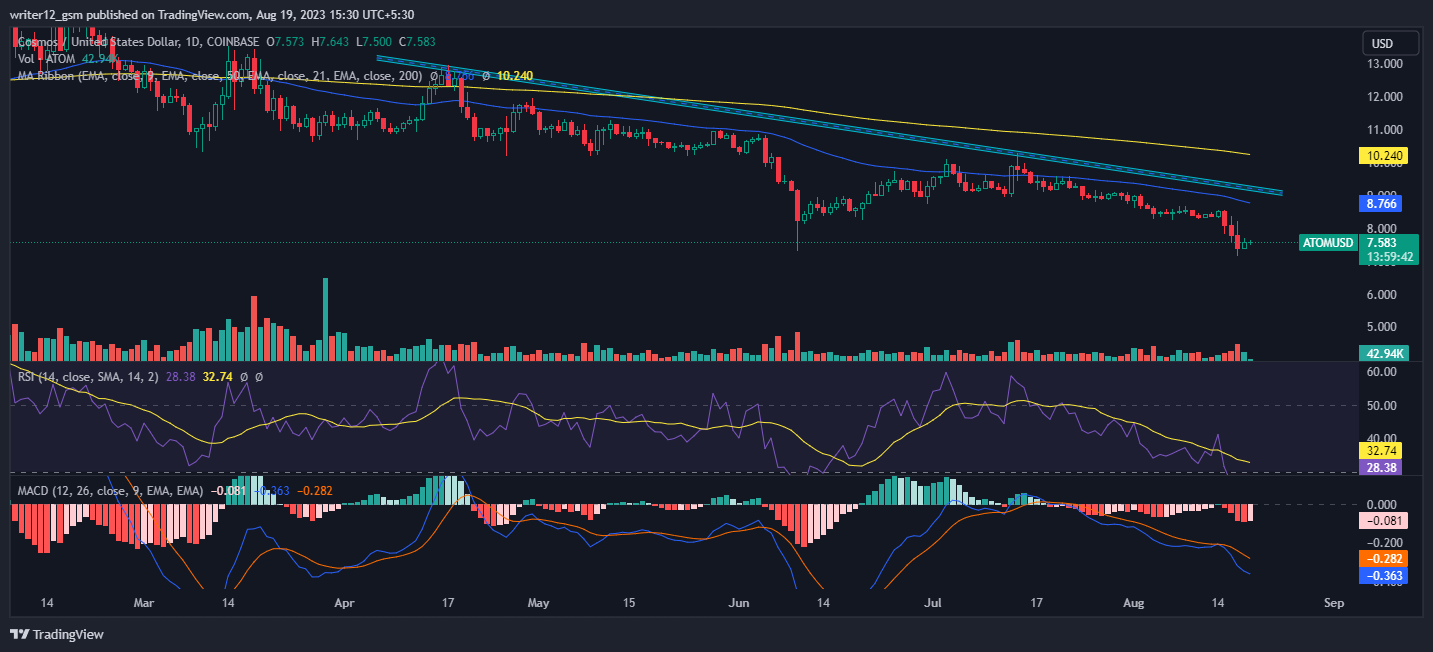
Cosmos is currently seeing a weak bearish momentum on the weekly technical charts. On the daily chart, the asset price shows strong downward momentum. ATOM price is currently between the 50, 100, and 200-day EMAs. If the price surges beyond the 200-day EMA, then a strong upside trend could be seen in the future.
The current scenario requires traders and investors to be patient and look for a clear break below or above the range before making any moves and avoid the fear of missing out to minimize losses.
ATOM price chart shows a falling scenario, having dropped more than 17.51% in a month and 9.18% in a week. However, Cosmos has given negative returns since the beginning of the year (-18.98%) while in the 6-month period, it gave -46.41% returns.
Nevertheless, the price might conquer supporting SMAs by making lower highs and lows if there is a spike in buying volume. Hence, the ATOMUSD price is expected to move downwards giving bearish views over the daily time frame chart.
If it can sustain at this level, Cosmos price could continue to go up and reach the first and second targets of $9.856 and $10.853, respectively. However, if the ATOMUSD price cannot sustain at this level and falls, then it might hit the closest support levels of $8.306 and $7.753.
ATOM price was $7.576 at press time with 24 hours trading volume of 42.932K. The last 10 days’ average volume is 253.696K. The current market cap of crypto is $2.625 Billion.
Technical Analysis of ATOM Crypto Price in 1-D Timeframe
ATOM’s price declined by 17.41% over the past month. At the time of writing, ATOMUSD crypto was trading at $7.579 and has been trying to hold on to this level after a major fall.
At the time of publishing, ATOM crypto (USD: ATOMUSD) is trading below the 50 and 200-day exponential moving averages, which are supporting the price trend.
The current value of the RSI is 28.10 points. The 14 SMA is above the median line at 32.72 points which indicates that the ATOM crypto is bearish.
The MACD line at -0.363 and the signal line at -0.282 are below the zero line. A bearish crossover is observed in the MACD indicator which signals more bearishness for the ATOMUSD crypto price.
Summary
ATOM price at present requires substantial support from the buyers in order to make a recovery as it is facing major resistance from the previous resistance points and multiple moving average levels. Buyers are pulling the price action into their grasp. The technical oscillators highlight the bearish trend. The MACD, RSI, and EMA are giving negative signs and imply that the downturn may continue in the ATOMUSD crypto price. ATOM price action suggests that the investors and traders are bearish on the 1-D time frame. The price action reflects a bearish perspective at the moment.
Technical Levels
- Support Levels: Nearest support levels are $8.306 and $7.753.
- Resistance Levels: Nearest resistance levels are $9.856 and $10.853.
Disclaimer
The analysis provided in this article is for informational and educational purposes only. Do not rely on this information as financial, investment, or trading advice. Investing and trading in crypto involves risk. Please assess your situation and risk tolerance before making any investment decisions.
Saurav Bhattacharjee is in charge of the Broadcast development team of The Coin Republic.
He has been covering the Metaverse and NFT niche for the past 2 years.
With stellar interviews on his portfolio like Nicehash, Paxful, WallstreetWolvesNFT, Bitholla, Totemfi, EOS.io etc. Saurav has spearheaded the NFT SUPERSTARS AWARD and successfully hosted the first award in 2021.


