
 Home
Home News
News
- 1 Litecoin crypto price decreased by 23.25% over the past seven days.
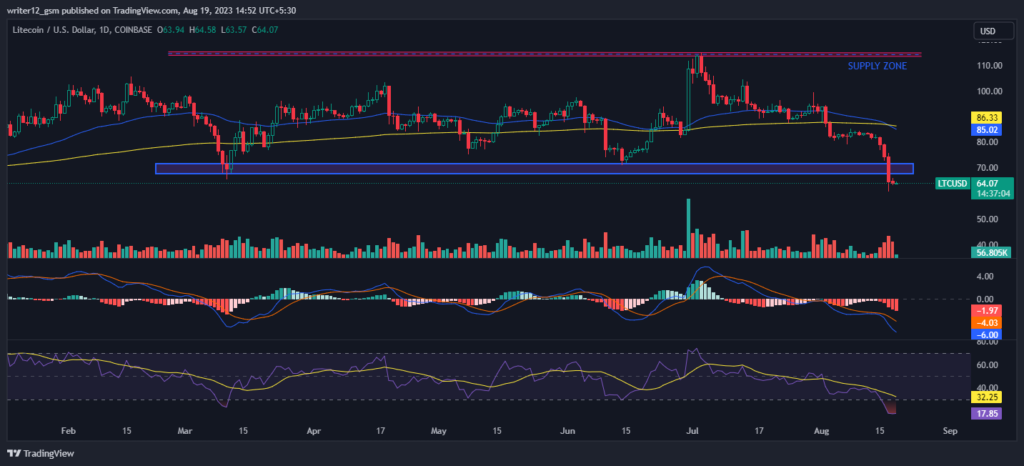
- 2 LTC crypto price at press time was $64.07 with a rise of 0.19% in the last 24 hours with a current market cap of $4.715 Billion.
- 3 LTCUSD is under bearish pressure.
The LTCUSD price prediction shows that the coin broke the lower trendline support on the daily time frame chart. Litecoin crypto needs to increase its positive momentum in order to break out from the bearish momentum. However, sellers may approach 50-SMA which is acting as a resistance to the crypto price. However, the 24-hour trading volume (56.69K) is lower than the 10-day average volume(167.699K).
LitecoinUSD has performed poorly so far this year. Year-over-year returns are -8.60% while returns over the past 6 months are -34.24%. The return was -30.24% last month and -23.27% last week. Technicals signal selling pressure while the technical oscillators indicate neutrality. The moving averages are also on the strong sell side. This shows bearish dominance in the market.
LTCUSD price prediction implies that investor sentiments regarding the Litecoin coin are bearish. Investors may prefer to keep a keen watch over the crypto. Presently, the Litecoin price is below all the key EMA and MA levels.
The present value of LTC is $64.05. It has a market capitalization of around $4.714K Million with a fully diluted market cap of $5.382 Billion. The crypto has a circulating supply of 73.557 Million.
The Litecoin crypto price prediction suggests the token produced an interesting declining pattern. The crypto is struggling to move above 50, 100, and 200-day daily moving averages.
Technical Analysis of Litecoin Crypto
At present, Litecoin crypto (USD: Litecoin) is trading below the 50 and 200-day simple moving averages, which shows bearish momentum.
However, if selling volume adds up, then the price might conquer supporting SMAs by making lower highs and lows. Hence, the Litecoin price is expected to move downwards giving bearish views over the daily time frame chart.
The current value of RSI is 18.08 points. The 14 SMA is below the median line at 32.27 points which indicates that Litecoin crypto is bearish.
The MACD line at -6.00 and the signal line at -4.03 are below the zero line. A bearish crossover is observed in the MACD which signals bearishness for the Litecoin crypto price.
Summary
Litecoin price action suggests that the investors and traders are bearish on the 1-D time frame. The price action reflects a bearish perspective at the moment. Litecoin (USD: Litecoin) technical indicators also support the bearish trend. The MACD, RSI, and EMA are emphasizing negative signs and imply that the downtrend may continue in the Litecoin crypto price.
Technical Levels
- Support Levels: Nearest support levels are $58.75 and $47.99
- Resistance Levels: Nearest resistance levels are $71.83 and $78.46.
Disclaimer
The analysis provided in this article is for informational and educational purposes only. Do not rely on this information as financial, investment, or trading advice. Investing and trading in crypto involves risk. Please assess your situation and risk tolerance before making any investment decisions.

Andrew is a blockchain developer who developed his interest in cryptocurrencies while pursuing his post-graduation major in blockchain development. He is a keen observer of details and shares his passion for writing, along with coding. His backend knowledge about blockchain helps him give a unique perspective to his writing skills, and a reliable craft at explaining the concepts such as blockchain programming, languages and token minting. He also frequently shares technical details and performance indicators of ICOs and IDOs.


