
 Home
Home News
News
- 1 CRDO stock dragged toward the 200-day EMA under selling pressure.
- 2 Bulls and bears are neck to neck
Credo Technology Group Holdings Ltd. (CRDO stock) price has lost the gains and is hovering near the 200-day EMA showing seller dominance on the charts. Moreover, the price action indicates a crossover, and sellers started making a short buildup, leading to a fall in the last sessions.
However, CRDO stock chart structure is signaling neutrality, and the price is still hovering in the congestion zone and could not manage the gains near the swing hurdle of $20, resulting in a throwback toward the 200-day EMA. Moreover, the buyers are trapped and start unwinding their positions, which could be a reason for the fall. CRDO stock price is close to the demand zone and may face further selling pressure.
At press time, CRDO stock price is trading at $14.02 with an intraday gain of 0.94%, showing neutrality in yesterday’s session. Moreover, the trading volume remained at 1.098 Million, and the market cap is $2.09 Billion. However, analysts maintained a strong buy and outperform rating with a yearly target price of $18.22 suggesting a growth outlook in the coming sessions.
Credo Technology Group Holding Ltd. develops connectivity solutions and products for the data infrastructure market. Its products include integrated circuits, active electrical cables, and SerDes chipsets. The company was founded by Chi Fung Cheng and Yat Tung Lam in September 2014 and is headquartered in George Town, Cayman Islands.
CRDO Stock Shows Selling Pressure On Daily Charts
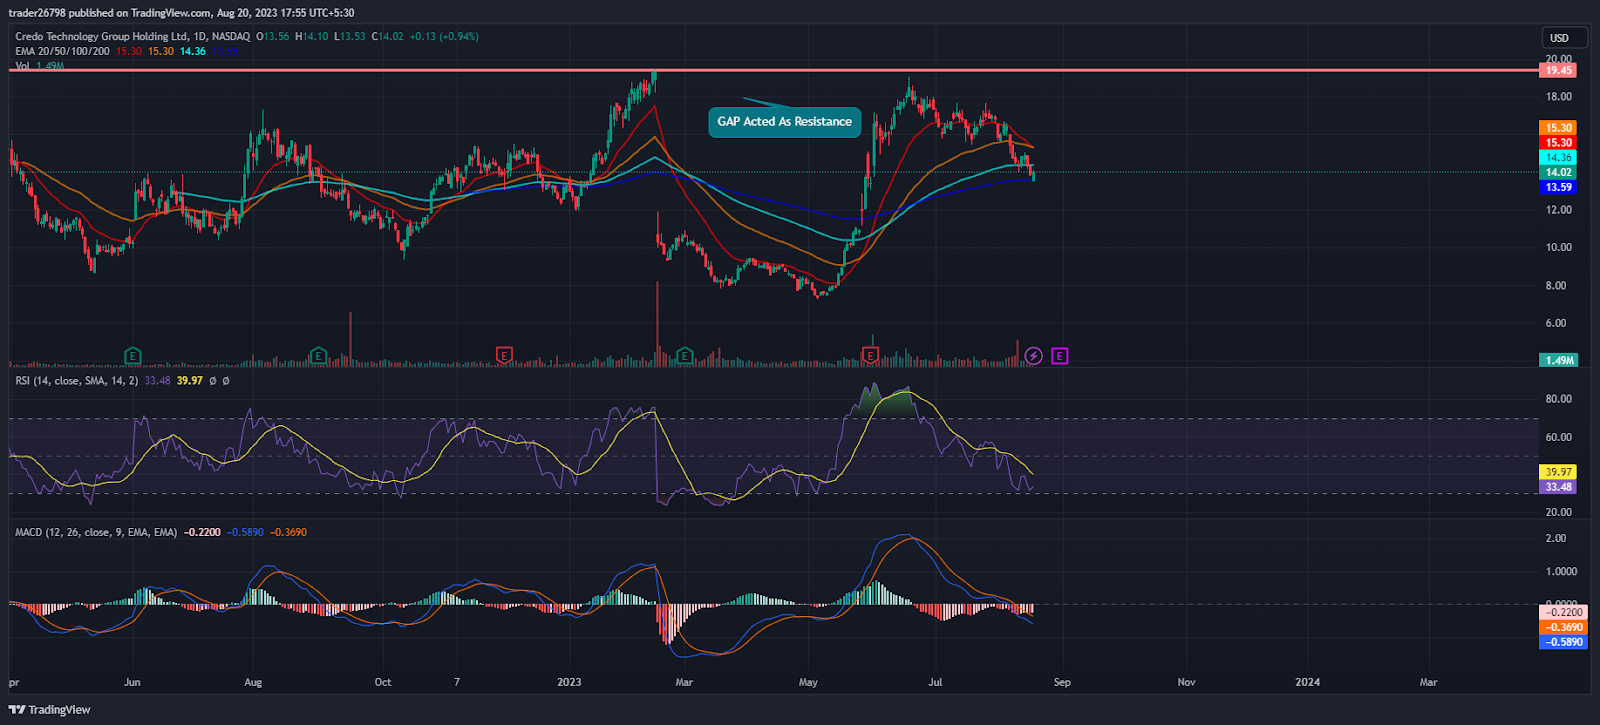
CRDO stock price showed roller coaster moves and re-entered the congestion zone near $15, close to the 200-day EMA on the daily charts. However, buyers must accumulate prices and attain a rebound to rescue the gains.
Moreover, CRDO stock will soon post its Q2 earnings results, and ahead of it, sellers attempted to drop the price below the support range of $10.
As per the Fib levels, CRDO stock price could not surpass the 50% zone and faced rejection resulting in a fall toward the 23.6% zone. Moreover, the price trades near the lower Bollinger band and shows a negative outlook on the charts.
The RSI curve dragged toward the oversold region showing a bearish divergence and signalling a selloff on the charts.
The MACD indicator persisted in forming the histogram’s red bars, and a bearish crossover indicated intense selling pressure on the charts. Moreover, if the price slips below the 200-day EMA, a free fall can be seen toward $10.
Conclusion
CRDO stock chart shows fresh selling pressure with the price heading for hte 200-day EMA. Moreover, the negative trend indicates a further selloff toward the lower trajectory of $10, which sellers tried to attain.
Technical Levels:
Support Levels: $12 and $10
Resistance Levels:$15 and $18
Disclaimer
The views and opinions stated by the author, or any people named in this article, are for informational purposes only and do not establish financial, investment, or other advice. Investing in or trading crypto assets comes with a risk of financial loss.
Mr. Pratik chadhokar is an Indian Forex, Cryptocurrencies and Financial Market Advisor and analyst with a background in IT and Financial market Strategist. He specialises in market strategies and technical analysis and has spent over a year as a financial markets contributor and observer. He possesses strong technical analytical skills and is well known for his entertaining and informative analysis of the Financial markets.


