
 Home
Home News
News
- 1 The Graph price prediction suggests the recent downfall is temporary and GRT crypto will recover soon.
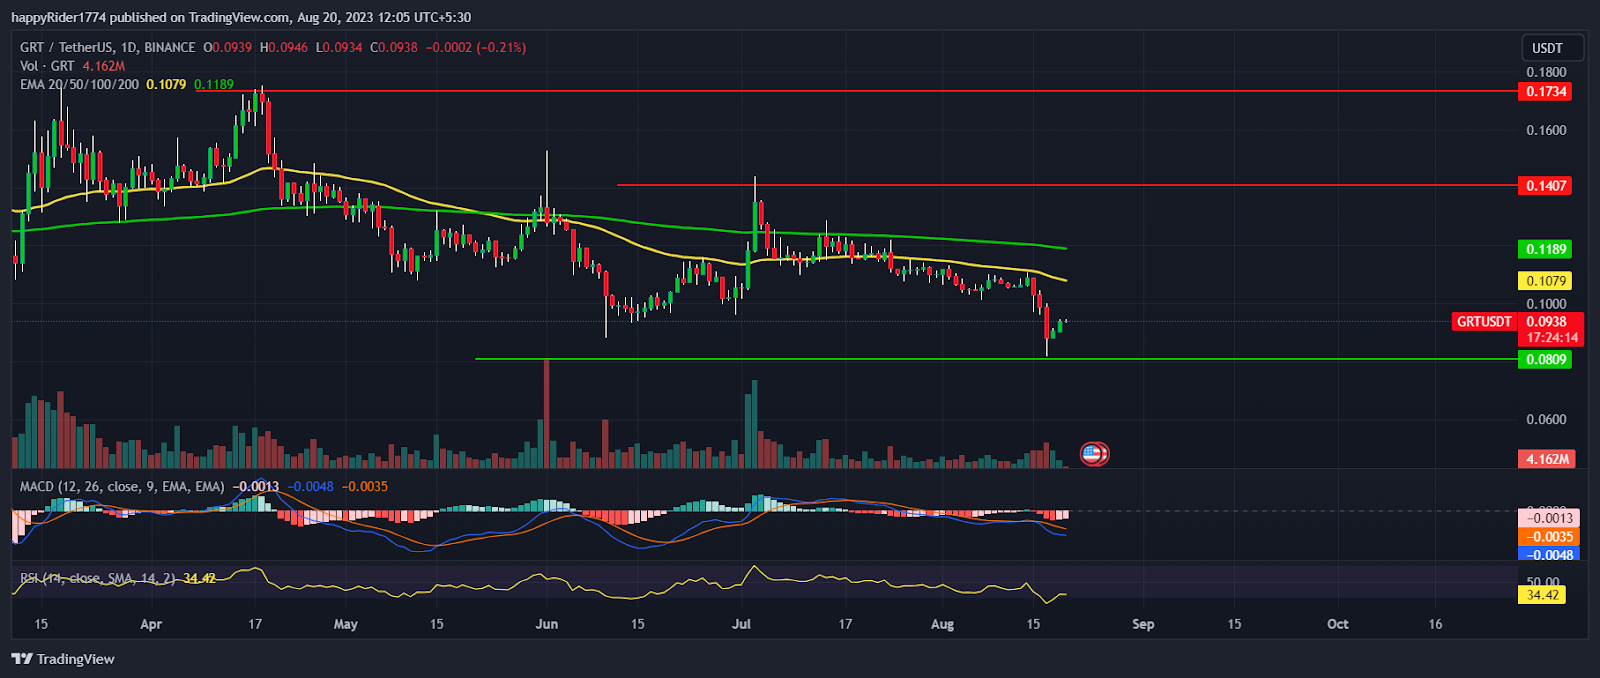
- 2 GRT price fell 12% in the current week and drops below $0.1000 support.
- 3 The Graph cryptocurrency price faced difficulty to climb above the 50-day EMA.
The Graph price prediction suggests a rise in the long run. The recent downfall is due to the external factors which shook the crypto market. But GRT price remains bullish and buyers seem active near support.
GRT cryptocurrency price faces difficulty to climb above the 50-day EMA. It shows that for the short term, prices are mildly bearish but buyers are trying their best to rebound.
The 200-day EMA sloping sideways denotes prices lacked direction and may continue to consolidate in a range.
Previously, Graph prices have consolidated in the wide range between $0.1000 to $0.1400. It showed the signs of long-term base formation and created hope of positive returns in 2023.
In the beginning of July, GRT price attempted to break out of the $0.1400 hurdle with a strong buying volume. Sadly, the attempt was not successful and the price faced rejection from the supply zone.
Slow and steady prices declined and returned back to the lower range. The Graph price is trading at $0.0940 on a flat bais. The 24-hour volume to market cap is 5.74%.
The Graph Price is near to Demand Zone
The Graph price prediction suggests a pullback rally may trigger anytime from the lower levels. The recent downfall has made the price cheap and attractive which might have grabbed the attention of investors.
Till the GRT crypto price holds the $0.0800 level the possibility of bounce back remains high. However, the rally in GRT will begin when buyers are able to break out of the $0.1400 hurdle.
On the other hand, if the correction continues and GRT prices slip below $0.0800. Then it may raise concerns for the long-term investors.
GRT Price Analysis on Weekly Time Frame
GRT price is forming a long tail hammer candle on the weekly time frame. It shows that the responsive buyers are active and trying their best to defend the support. The prices had gone far from the EMAs so a relief rally is possible in the coming weeks.
The MACD curve trades below the zero line and the histogram is red indicating mild bearishness. Whereas, the RSI at 34 is near the oversold territory. The super trend generated a sell signal but the price is near crucial support so the downside looks limited.
Conclusion
The Graph price prediction remains bullish for the long term till it holds $0.0800 support.
The technical analysis suggests GRT price is near the demand zone and highly undervalued. So, buyers might show their interest and come forward to push the price higher.
Technical levels
- Resistance levels: $0.1300 and $0.1400
- Support levels: $0.0800 and $0.0700
Disclaimer
The views and opinions stated by the author, or any people named in this article, are for informational purposes only. They do not establish financial, investment, or other advice. Investing in or trading crypto assets comes with a risk of financial loss.
Steve Anderson is an Australian crypto enthusiast. He is a specialist in management and trading for over 5 years. Steve has worked as a crypto trader, he loves learning about decentralisation, understanding the true potential of the blockchain.


