
 Home
Home News
News
- 1 Sandbox crypto’s price decreased by 17.58% over the last week and is down by 0.96% over the last 24 hours.
- 2 The price of the SAND crypto is trading at $0.32320000 and the 52-week range is $0.297150000 – $0.94046000.
The SAND crypto (BITFINEX: SAND) has not performed well in the last month, decreasing by 26.89% and by 58.01% in the last six months.
Sandbox crypto declined by 0.63% in market value and also plummeted by 6.79% in trading volume in the last 24 hours, as per Coinmarketcap, a crypto data analysis website. Its market value is $665,07,752 and its trading volume is $49,649,998. There are 2,057,931,926 SAND in circulation.
Sandbox Crypto’s (SAND) open interest is $37.08 Million. As per Coinglass, another crypto analysis website, it fell by 2.55% in the previous session. The long versus short ratio for 24 hours is 0.8776. The short liquidation is $14.74K versus $208.44K for the long liquidation.
Sandbox Price Technical Analysis in the 1-Day Timeframe
SAND crypto price showed a downward trend for the past three months by making lower lows and highs, decreasing by 36.40% during this period. At the time of publication, the SAND crypto price is trading at a price of $0.32320000, and the crypto is trading at the very crucial support around $0.29895541.
Therefore, if the SAND crypto price sustains the current level and rises, then it might hit the nearest resistance levels of $0.41512238 and $0.47887254.
However, the SAND crypto price could continue to move downward, if it fails to sustain the current level and reach $0.29895541 and $0.24653861.
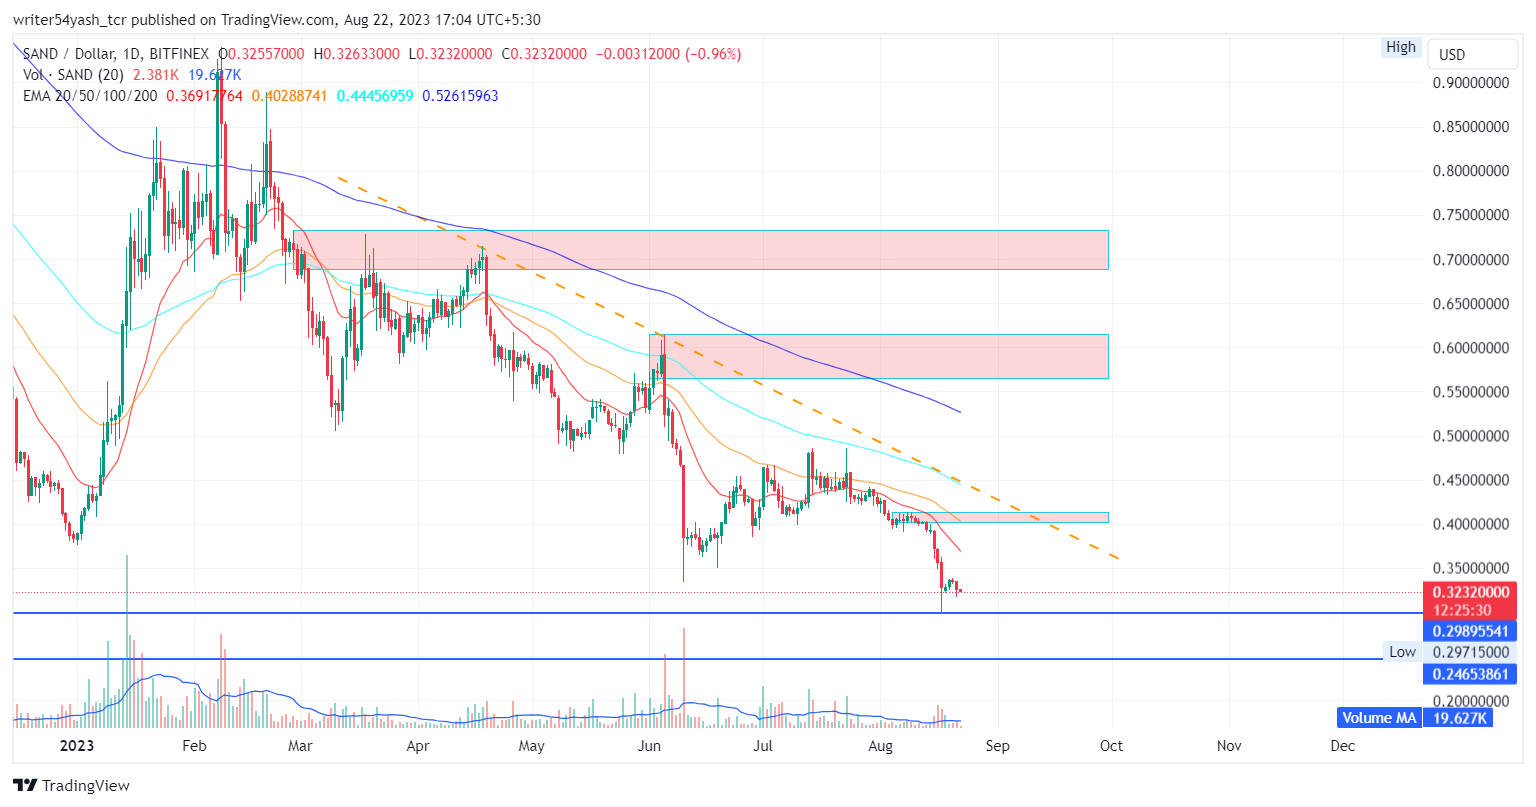
At the time of publishing, the SAND crypto price (BITFINEX: SAND) is trading beneath the 20, 50, 100, and 200-day exponential moving averages (EMA), which is declining the SAND crypto price trend down.
Hence, SAND crypto price prediction estimates the prices to decline downwards, indicating a bearish overview over the daily time frame chart for its price.
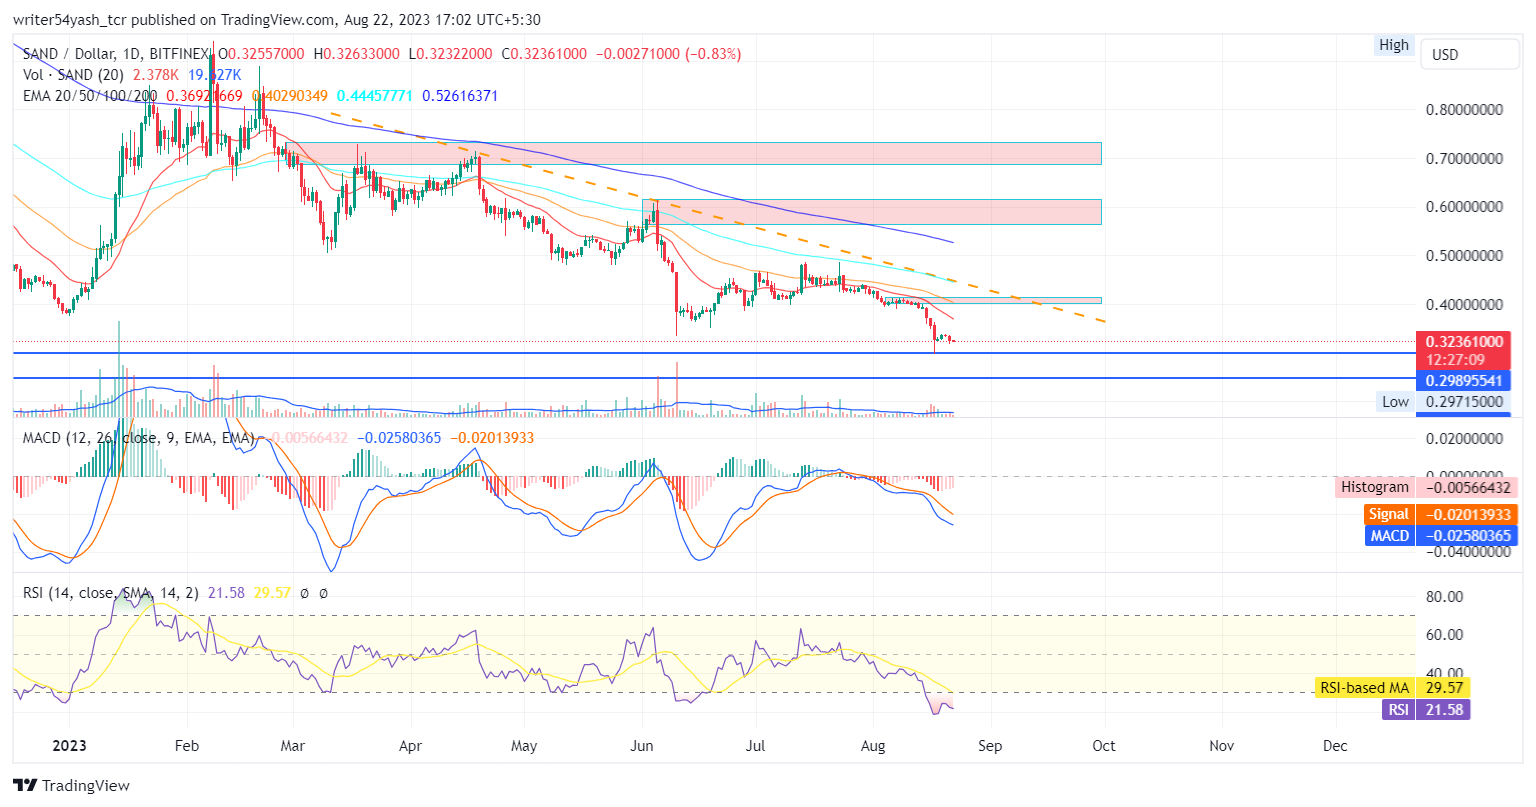
The MACD line at 0.02580 and the signal line at 0.02013 is below the zero line both lines crossed down to each other and a narrowed bearish crossover is spotted in the MACD oscillator, indicating consolidation to bearish signals in SAND crypto. The current value of the RSI is 21.50 points and the 14-day SMA is below the median line at 29.56 points, which indicates consolidation to bearish sentiments in SAND price.
Conclusion
SAND crypto price prediction highlights the bearish sentiments and perspectives regarding SAND crypto in the daily time frame. Sandbox price action highlights a bearish view at the time of publishing. Moreover, the technical parameters of Sandbox price suggest the continuation of the downtrend over the daily time frame chart. Major reliable and trustworthy indicators MACD, RSI, and EMA, suggest bearish signals regarding the SAND crypto price.
Technical Levels:
- Support levels: The nearest support levels are $0.29895541 and $0.24653861.
- Resistance levels: The nearest resistance levels are $0.41512238 and $0.47887254.
Disclaimer
In this article, the views and opinions stated by the author, or any people named are for informational purposes only, and they don’t establish the investment, financial, or any other advice. Trading or investing in cryptocurrency assets comes with a risk of financial loss.

Nancy J. Allen is a crypto enthusiast, with a major in macroeconomics and minor in business statistics. She believes that cryptocurrencies inspire people to be their own banks, and step aside from traditional monetary exchange systems. She is also intrigued by blockchain technology and its functioning. She frequently researches, and posts content on the top altcoins, their theoretical working principles and technical price predictions.


