


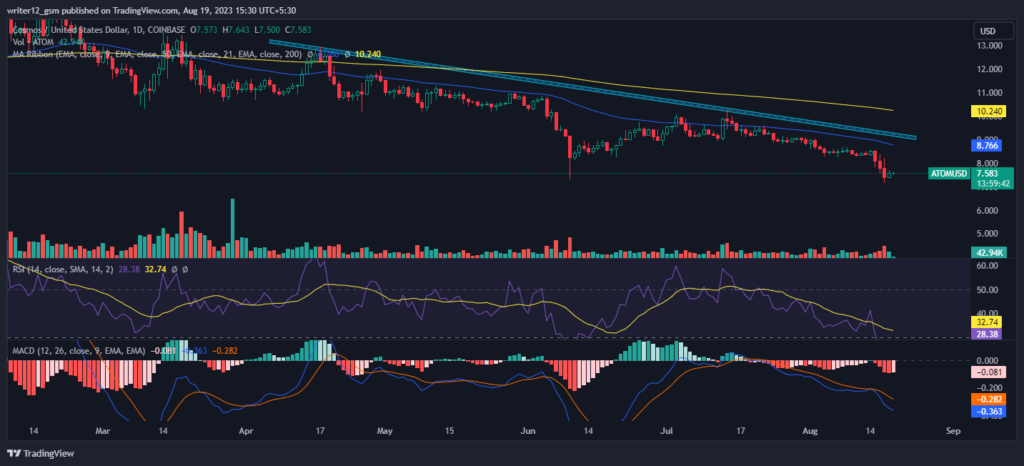
The Cosmos chart shows a weak bearish momentum on the daily technical charts. On the daily chart, the asset price shows strong downward momentum. ATOM price is currently between the 50, 100, and 200-day EMAs. If the price surges beyond the 200-day EMA, then a strong upside trend could be seen in the future.
Cosmos crypto price chart shows a falling scenario, having dropped more than -18.40% in a month and -5.60% in a week. However, Cosmos has given negative returns since the beginning of the year (-21.38%) while in the 6-month period, it gave -43.77% returns.
However, the price might conquer supporting EMAs by making lower highs and lows if there is a spike in buying volume. Hence, the Cosmos crypto price is expected to move downwards giving bearish views over the daily time frame chart.
The current scenario requires traders and investors to be patient and look for a clear break below or above the range before making any moves and avoid the fear of missing out to minimize losses.
If Cosmos crypto can sustain at this level, Cosmos’ price could continue to go up and reach the first and second targets of $9.800 and $10.800, respectively. However, if the ATOMUSD price does not sustain at this level and falls, then it might hit the closest support levels of $8.300 and $7.750.
Cosmo’s price was $7.350 at press time with 24 24-hour trading volume of 43.84K. The last 10 days’ average volume is 269.22K. The current market cap of crypto is $2.545 Billion.
Technical Analysis of Cosmos Crypto
Cosmos price declined by 18.40% over the past month. At the time of writing, ATOMUSD crypto was trading at $7.352 and has been trying to hold on to this level after a major fall.
Cosmos crypto (ATOMUSD) is trading below the 50, 100 and 200-day exponential moving averages. The current value of the RSI is 30.09 points. The 14 SMA is above the median line at 31.84 points which indicates that the ATOM crypto is bearish.
The MACD line at -0.386 and the signal line at -0.341 are below the zero line. A bearish crossover is observed in the MACD which signals more bearishness for the ATOMUSD crypto price
Summary
Cosmos’s price at present requires significant backing from the bulls in order to make a comeback as it is facing major resistance from the previous resistance levels and multiple moving average levels. Buyers are dominating. The technical oscillators highlight the bearish trend. The MACD, RSI, and EMA are giving negative signs and imply that the downturn may continue in the ATOMUSD crypto price. ATOM price action suggests that the investors and traders are bearish on the 1-D time frame. The price action reflects a bearish perspective at the moment.
Technical Levels
- Support Levels: Immediate support levels are $8.300 and $7.300.
- Resistance Levels: Immediate resistance levels are $9.800 and $10.800.


