
 Home
Home News
News
- 1 USB stock’s CMP is $36.25, facing resistance and declining below all major EMA’s.
- 2 USB stock price decreased by 3.18% over the past week and the current volume is below average.
- 3 US Bancorp ( NYSE: USB) stock’s 52-week price range is around $27 – $49.
US Bancorp’s (USB) stock market capitalization is $55.57 Billion and the total revenue is $27.402 Billion. Moreover, the stock’s basic EPS is $3.60 and the price-to-earnings ratio is 9.96. US Bancorp (USB) experienced a decline in its earnings at a rate of 1.8% per year on average, according to Simply Wall St., a financial website. The average annual earnings growth of the bank industry is 14.0%. Therefore, USB earnings are lower than the industry average.
As per Simply Wall St.’s recent insider transactions, the insiders have been selling the stock. In the last three months, 39,816 shares have been sold and the Vanguard Group, Inc. is the top shareholder and owns 8.35% of the company.

USB Stock Price Technical Analysis in 1-D Timeframe
The price action shows that US Bancorp ( NYSE: USB) stock price took rejection from the major supply zone around $49 on January 25th as seller pressure was high and fell almost 45% by May 16th and reached the major demand zone at $29.
At the time of publication, the USB Stock’s current price is trading around $36.25 and facing resistance, US Bancorp, Inc. stock may decrease further and US Bancorp’s might reach back to the demand zone.
Therefore, If US Bancorp fails to maintain its current level, the USB price could continue to drag downwards and hit the nearest support levels around $31.71 and $29.43.
However, if the stock price sustains the current level and the US Bancorp price increases, then it might reach the nearest resistance levels of $40.12 and $41.73.
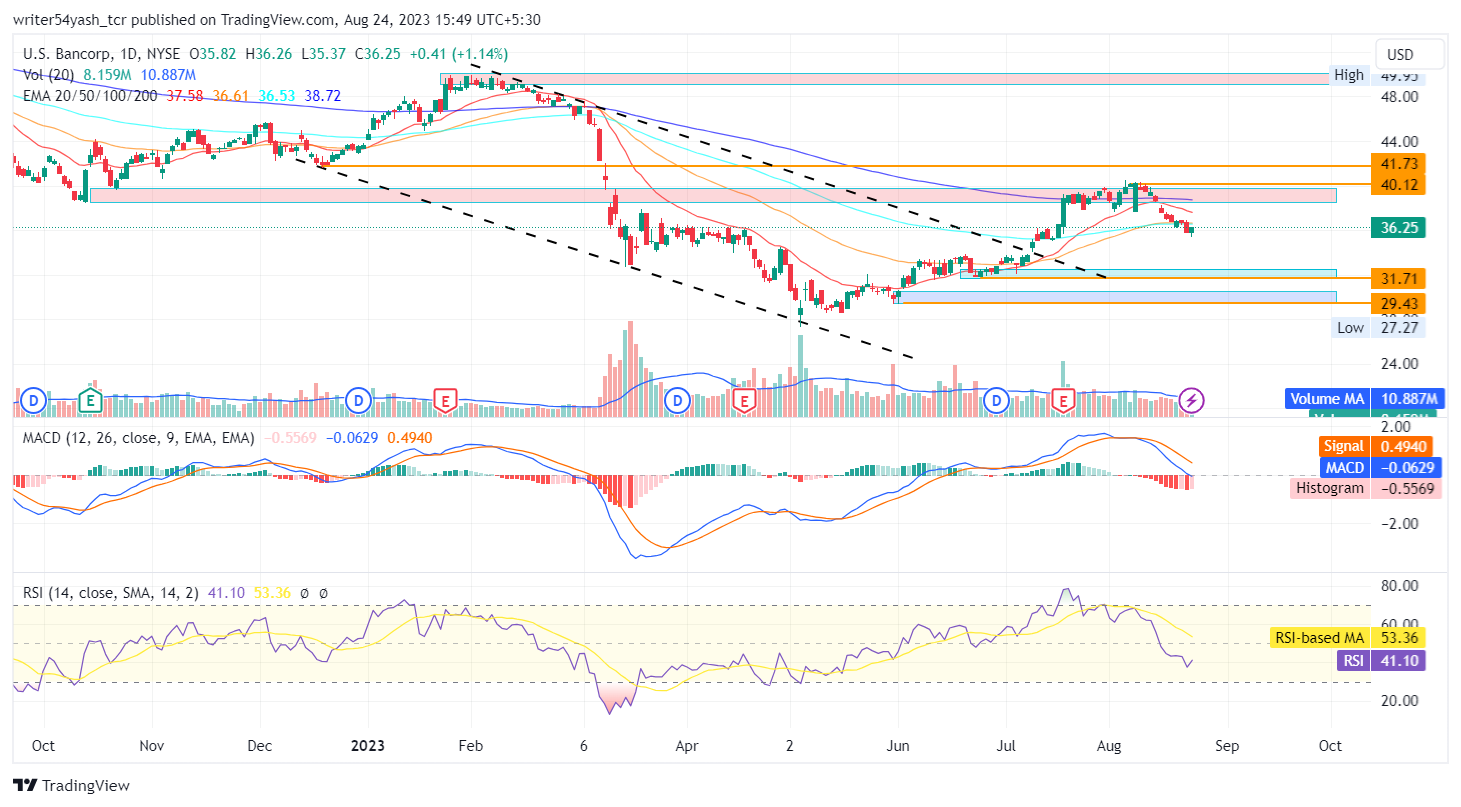
At the time of publishing, US Bancorp. (NYSE: USB) is trading below all major exponential moving averages (EMA’s – 50, 100, and 200-day).
The current value of RSI is 41.10 points. The 14 SMA is above the median line at 53.36 points which indicates that USB stock is in bearish territory and the RSI took rejection from the 14 SMA line.
The MACD line at 0.0629 and signal line at 0.4940 are above the zero line and both lines have crossed each other. A bearish crossover is noticed in the MACD oscillator which expresses bearishness for the US Bancorp stock price.
Summary
US Bancorp (NYSE: USB) indicates that the traders and investors of the stock price are bearish on the 1-D time frame. The price action of USB stock shows a bearish outlook at the time of publishing. The most sought and reliable technical analysis tools such as EMA, RSI, and MACD for USB stock price also support bearishness and indicate that a downtrend may continue in US Bancorp stock price.
Technical Levels
- Support levels: The nearest support levels for USB stock price are $31.71 and $29.43.
- Resistance levels: The nearest resistance levels for the USB stock price are $40.12 and $41.73.
Disclaimer
In this article, the views and opinions stated by the author, or any people named are for informational purposes only, and they don’t establish the investment, financial, or any other advice. Trading or investing in cryptocurrency assets comes with a risk of financial loss.

Andrew is a blockchain developer who developed his interest in cryptocurrencies while pursuing his post-graduation major in blockchain development. He is a keen observer of details and shares his passion for writing, along with coding. His backend knowledge about blockchain helps him give a unique perspective to his writing skills, and a reliable craft at explaining the concepts such as blockchain programming, languages and token minting. He also frequently shares technical details and performance indicators of ICOs and IDOs.


