
 Home
Home News
News
- 1 BCS stock price is showing selling pressure and persisted in the fall.
- 2 Bears looked aggressive and continued to make short positions.
Barclays PLC (BCS stock) chart shows volatility and is trading below the key moving averages, noted selling pressure on the charts. Moreover, the price action favours the bears and indicates that BCS stock has persisted in a narrow range and is trading in a downtrend.
However, the trend went negative when BCS stock failed to surpass the cluster near $8.60, and buyers started unwinding their positions, resulting in a reversal from there. Furthermore, the chart shows a head and shoulder pattern and noted a trendline breakdown below $7.80 in the last sessions.

BCS stock price is heading to retest the demand zone near $7.00 and continues to decline inside the falling channel. However, these ups and downs continued in the past months, and stock traded in a narrow range, lowering the stock demand. The price action suggests a negative outlook as BCS share trades below neutrality.
Furthermore, BCS stock is close to the 23.6% Fib level, which, if it breaks, leads to a free fall toward $7.00, followed by $6.80 in the upcoming sessions. Moreover, the price is trading near the lower bollinger band, indicating a downtrend of the stock.
At press time, BCS share price is trading at $7.33 with an intraday drop of 0.14%, showing bearishness on the charts. Moreover, the trading volume remained average at 8.758 Million, and the market cap is $28.051 Billion. However, analysts remained neutral, with a yearly target price of $11.63.
BCS stock has been underperforming and given negative returns for the past months. BCS share has a weekly return of (- 1.38%) and monthly (- 13.46%), whereas yearly of (-5.17%) showed a downtrend from the last year.
About BCS Stock
Barclays Plc is a bank holding company that provides retail banking, credit cards, corporate and investment banking, and wealth management services.
The firm operates through Barclays UK and Barclays International segments.
The Barclays UK segment consists of the U.K. retail banking operations, U.K. consumer credit card business, U.K. wealth management business and corporate banking for small businesses.
BCS Stock Price Action on Daily Charts
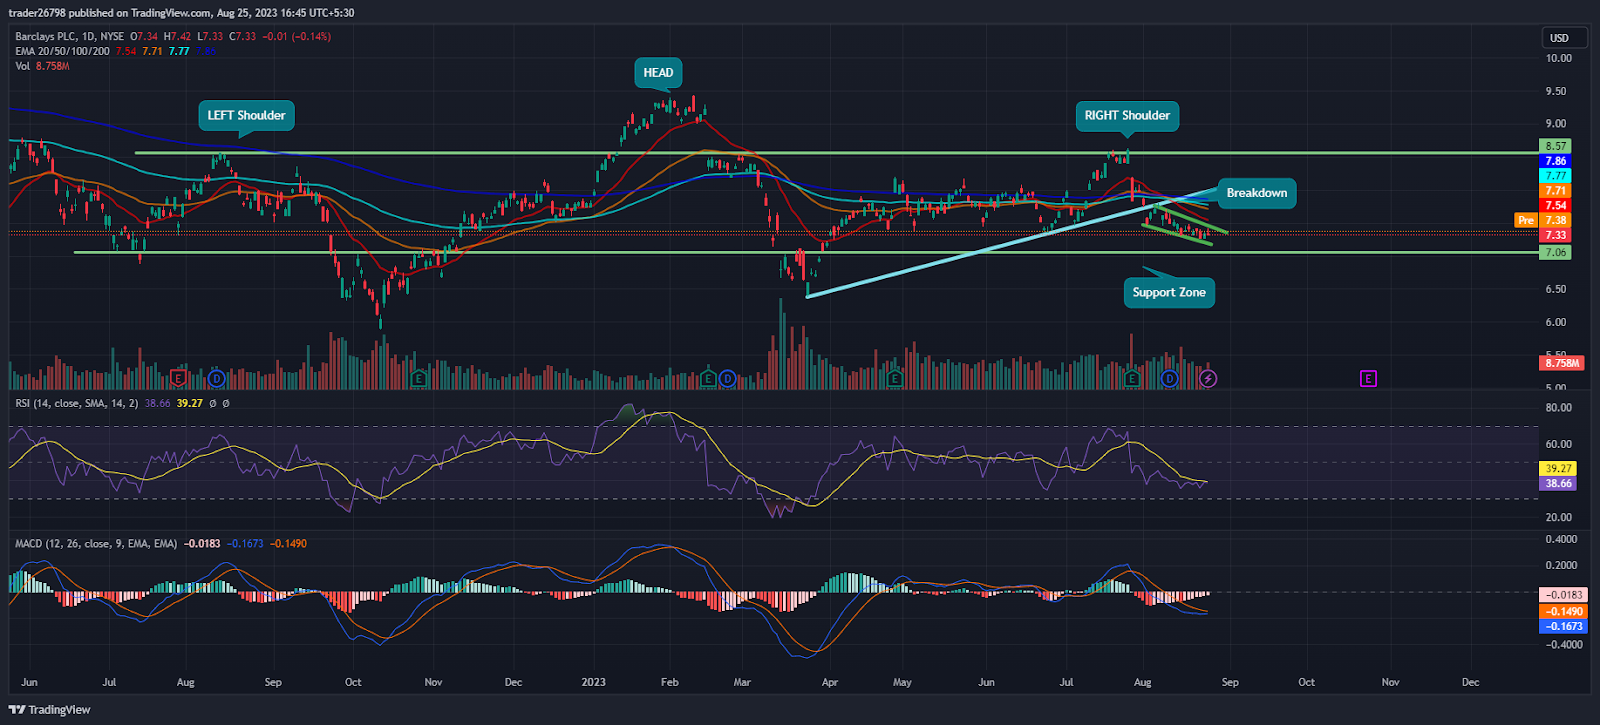
BCS stock price was trading below the cluster of $8.00 and persisted in falling in the past sessions and heading toward the demand zone of $7.00.
The RSI curve headed in the oversold region, showing a bearish divergence on the charts, indicating a negative outlook for the following sessions.
The MACD indicator showed a bearish crossover and suggested a follow-up selling toward the demand zone of $7.00 for the following sessions.
Summary
Barclays PLC (BCS stock) price is trading in a downtrend and persisted in underperforming for the past months. Moreover, the stock has a negative return ratio, resulting in lower demand and interest. Furthermore, the stock is below the 200-day EMA, showing a negative outlook for the following sessions.
Technical Levels
Support Levels: $7.00 and $6.80
Resistance Levels: $7.80 and $8.00
Disclaimer
The views and opinions stated by the author, or any people named in this article, are for informational purposes only, and they do not establish financial, investment, or other advice. Investing in or trading crypto or stock comes with a risk of financial loss.
Mr. Pratik chadhokar is an Indian Forex, Cryptocurrencies and Financial Market Advisor and analyst with a background in IT and Financial market Strategist. He specialises in market strategies and technical analysis and has spent over a year as a financial markets contributor and observer. He possesses strong technical analytical skills and is well known for his entertaining and informative analysis of the Financial markets.


