
 Home
Home News
News
- 1 NNDM stock price showed bearishness in the past few trading sessions.
- 2 Nano Dimensions stock price (NYSE: NNDM) has declined nearly 15% in the last 28 days from its recent swing high.
Nano Dimensions (NNDM stock) has been under selling pressure after a hike of nearly 45% from the bottom. Previously, the price seemed to be sideways and Volatile on the daily charts and bottomed out from a round level of $2 and surged breaking above the previous swing high.
The price slipped after breaking above the recent swing high of $3. The short-term hike led to the profit booking as the investors feared the pre-earning sentiments. The price tried to sustain above the key moving average of 50 EMA but failed and currently nearing the previous breakout zone and 200 EMA from where the buyers may dominate the game.

The quarterly results topped the Wall Street estimates but, did not leave a major impact on the stock. The Company reported Q2 results with organic growth of 47% in the last 3 quarters and 33% growth as compared to the last quarter same year.
At press time, NNDM stock price was $2.78 with an intraday decline of 2.8%, declining towards its recent support. Moreover, the trading volume decreased to 1.33 Million, and the market cap is $6.07 Billion.
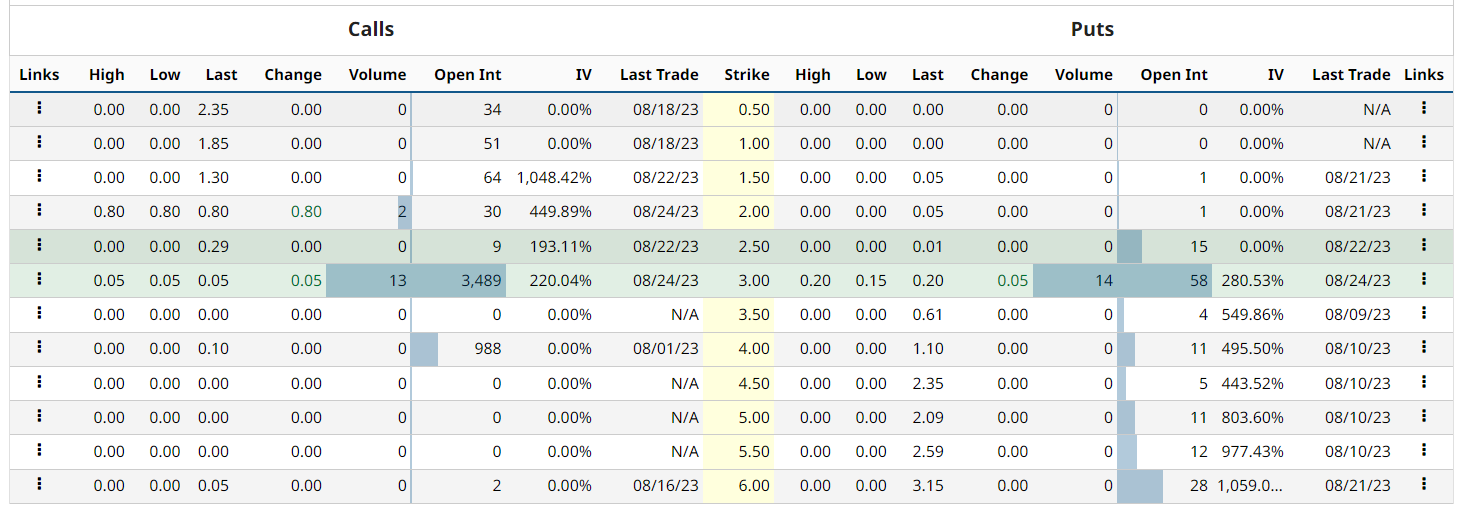
NNDM stock option-chain analysis states that the current implied volatility in the market is 82.4% with an increment of 5.81% in the last trading session. The at-the-money strike price has 15 open contracts on the put side and 9 open contracts on the call side indicating the dominance of buyers at the current level. The PUT/CALL ratio is 0.12 indicating that sellers dominating at the moment as per the data.
NNDM Stock Price Showed Bearishness After Breakdown Of 50 EMA
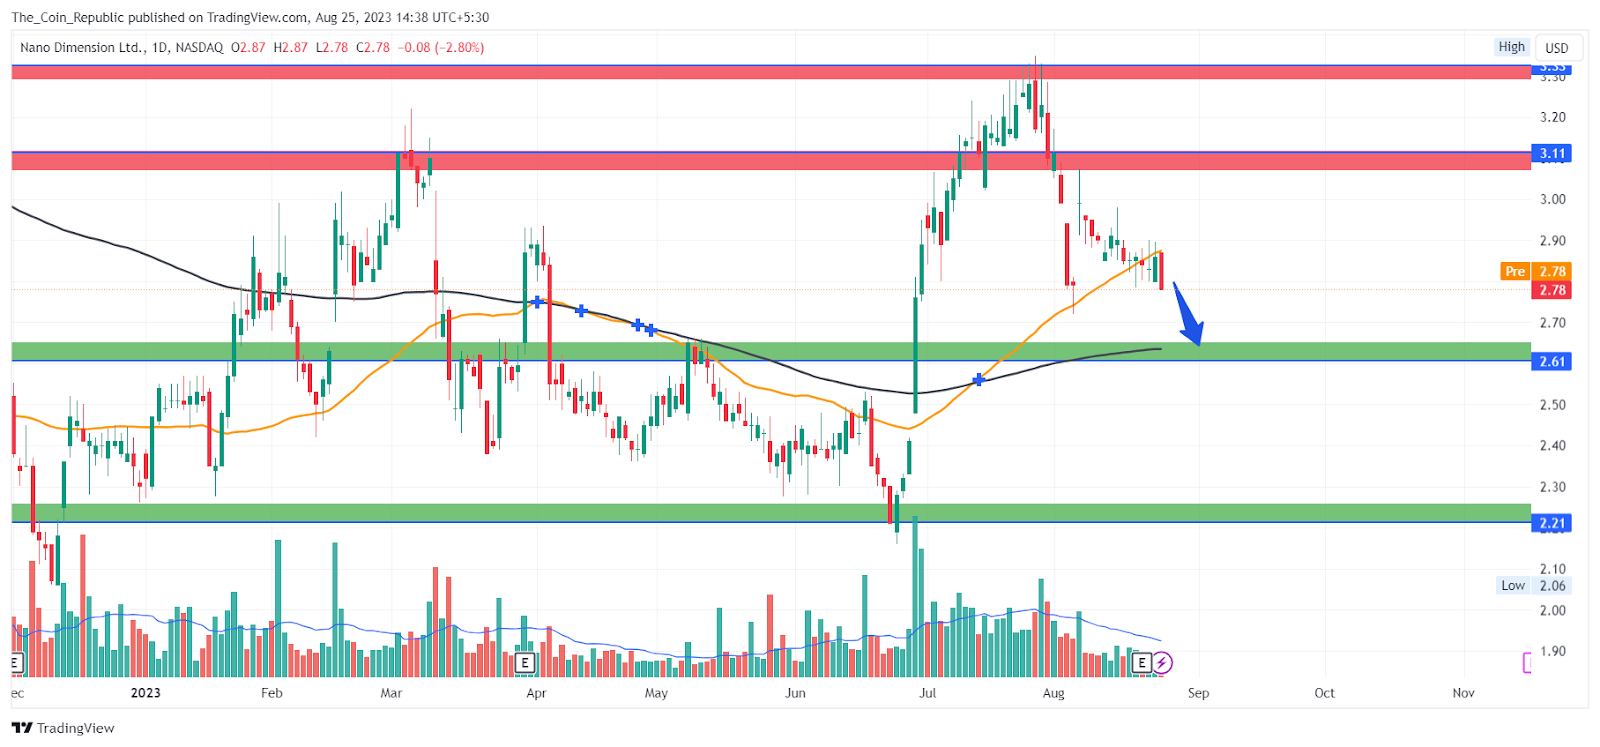
The NNDM stock is currently declining again after failing to sustain above 50 EMA. The price is nearing the recent support zone from where it may get the buyers back and halt the decline.
The price has changed its long-term trend to an uptrend hence, if the price sustains above the recent support then it might lead to the formation of a higher low, and the price may resume its long-term trend.
The EMAs Showing Strength Over The Daily Chart
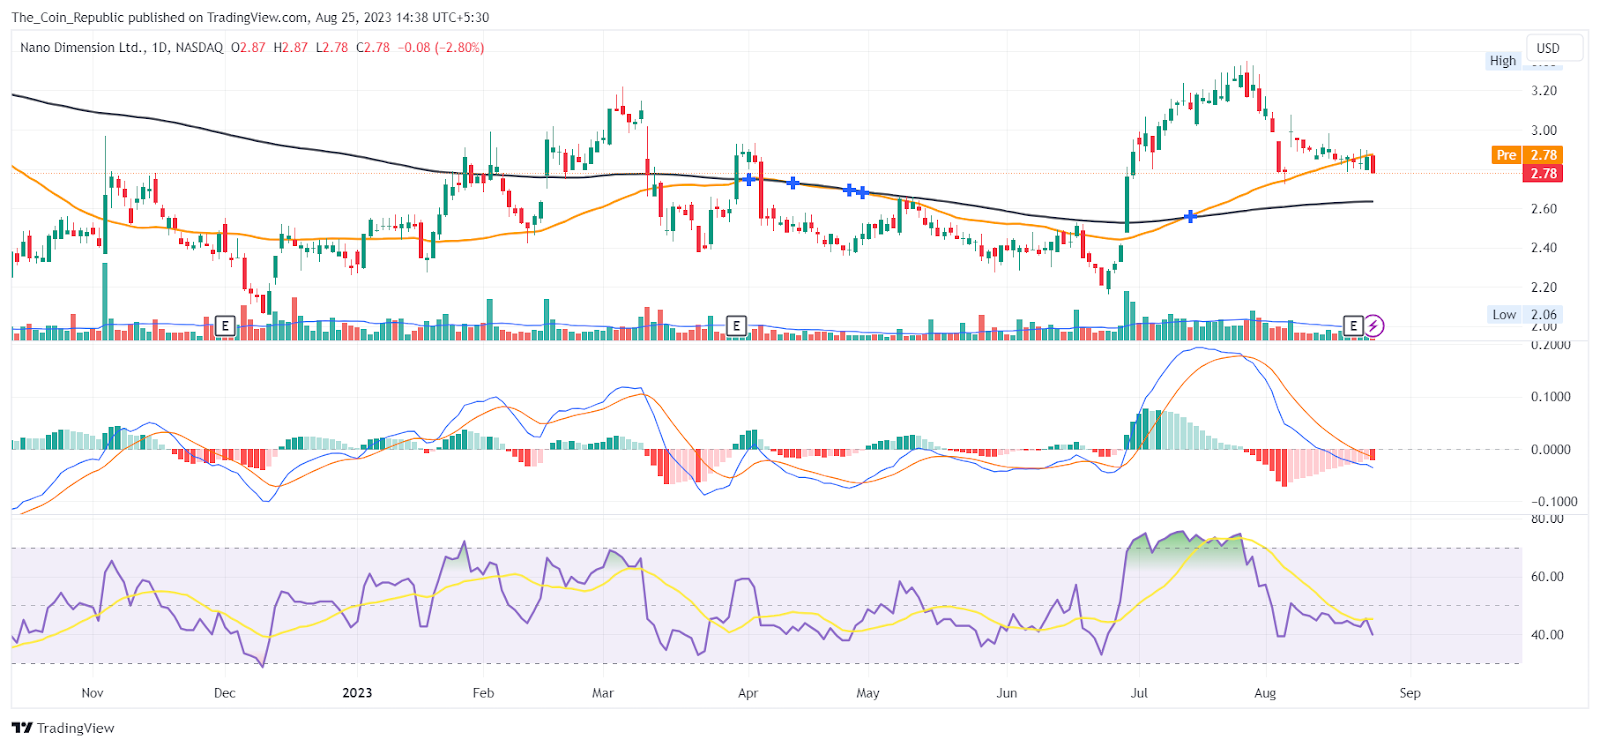
The daily NNDM stock price chart shows that the price is trading above 200 EMA indicating strength over the daily timeframe. However, the stock failed to sustain above 50 EMA indicating bearishness in the short-term.
The overall Technical Opinion rating including RSI and MACD is signaling a 56% buy with a weak short-term outlook on maintaining the current direction.
Conclusion
NNDM stock price rose 45% from $2 to $3.33 but fell back due to profit booking and pre-earning sentiments. The stock failed to stay above 50 EMA and is approaching the previous breakout zone and 200 EMA, which may act as support. The company reported Q2 results with organic growth of 47% and 33% year-over-year, but the stock did not react much. The stock is in a long-term uptrend but may need to form a higher low above the recent support to resume its rally.
Technical Levels
- Support levels: $2.61 and $2.21.
- Resistance levels: $3.11 and $3.33.
Disclaimer
The views and opinions stated by the author, or any people named in this article, are for informational purposes only and do not establish financial, investment, or other advice. Investing in or trading crypto or stock comes with a risk of financial loss.

Nancy J. Allen is a crypto enthusiast, with a major in macroeconomics and minor in business statistics. She believes that cryptocurrencies inspire people to be their own banks, and step aside from traditional monetary exchange systems. She is also intrigued by blockchain technology and its functioning. She frequently researches, and posts content on the top altcoins, their theoretical working principles and technical price predictions.


