
 Home
Home News
News
- 1 On August 25, 2023, Friday, C stock price closed at $41.24, with a 0.39% intraday surge.
- 2 In year-to-date (YTD) price analysis Citigroup, Inc. stock lost 9.92%.
- 3 At the time of publishing, C stock was trading below the 20 day and 200 day exponential moving averages.
C stock price has fallen sharply since the beginning of this year. But in year-to-date (YTD) price analysis, it lost 9.92% to its trading price. The tumbling stock price shows an upside momentum on January 04 which helped the Citigroup Inc. stock regain momentum.
Will C Stock Fall More?
On August 25, 2023, Friday, C stock price closed at $41.24 with a 0.39% price surge intraday. The opening price during the trading session was $41.26 whereas the trading range was $41.26 to $41.66.
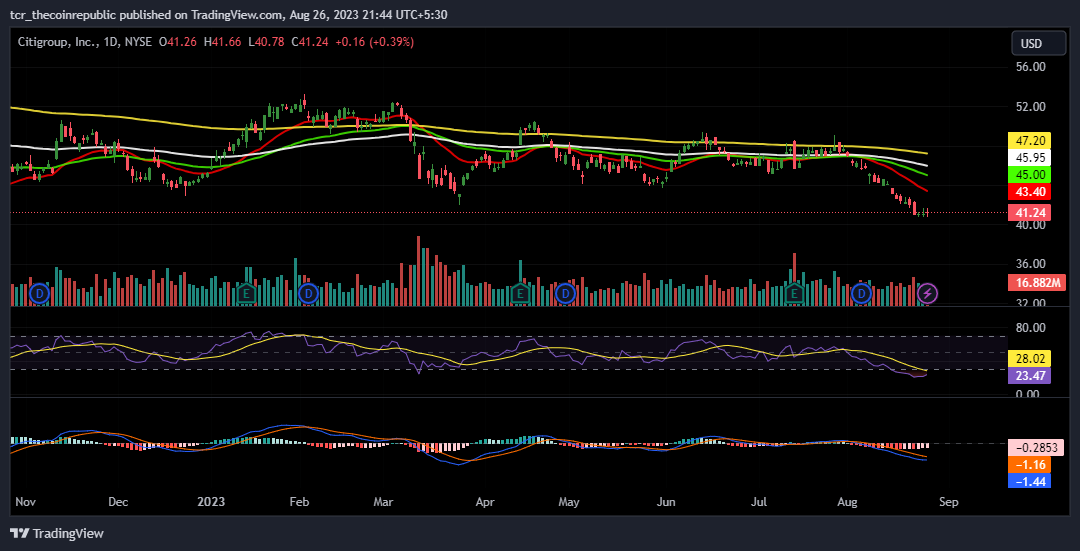
In the weekly time frame, Citigroup, Inc. stock lost 2.16% of its trading price and in the monthly time frame, it declined by 12.98%.
At the time of publishing, C stock was trading below the 20 day and 200 day exponential moving averages. In the 52 weeks time frame, the highest trading price of C stock was $53.23 and its lowest traded price was $40.41.
Technical analysis of Citigroup stock shows that the RSI is below neutrality and the signal line is close to the curve. A bounce to retest the trendline toward $43 is expected.
It is noted that if the bulls failed to dominate, then a rejection is expected at $43 which can drag C stock price below $40. The MACD shows a bearish crossover indicating selling pressure. Moreover, the signal line is quite far from the MA line indicating that buyers are trying hard to retain the momentum.
Q2 2023 Result Update of Citigroup, Inc.
Citigroup, Inc. operates through the following segments: Global Consumer Banking, Institutional Clients Group, and Corporate and Other.The market cap is around $79.416 Billion. On July 14, 2023, the company net income of $2.88 Billion Million in Q2 2023.
According to its Q2 2023 report, Citigroup, Inc. earnings per share (EPS) is $1.33 whereas the estimated figure was positive $1.30 which accounts for a positive 2.21%. The revenue for the same period of Citigroup, Inc. amounts to $19.34 Billion while the estimated figure was $19.44 Billion.
For the upcoming quarter, the estimated EPS is $1.29, and revenue is expected to reach $19.26 Billion.
According to TradingView, 1.918 Billion Citigroup shares are free floating and the remaining 6.459 Million shares are closely held by financial backers of the company or the board of directors.
Disclaimer
The views and opinions stated by the author, or any people named in this article, are for informational ideas only and do not establish financial, investment, or other advice. Investing in or trading crypto or stock comes with a risk of financial loss.
Steve Anderson is an Australian crypto enthusiast. He is a specialist in management and trading for over 5 years. Steve has worked as a crypto trader, he loves learning about decentralisation, understanding the true potential of the blockchain.


