
 Home
Home News
News
- 1 The Render Token network crypto’s price decreased by 3.03% over the last week and it is trading below major EMA’s.
- 2 The price of the RNDR crypto is trading at $1.371000 and the 52-week range is $0.558000 – $2.927000.
The RNDR crypto has not performed well in the last month, decreasing by 23.28% and by 5.05% in the last six months. Render Token Network (GEMINI: RNDR) crypto has a positive year-to-date return of 244.47% and a positive one-year return of 168.43%.
Render Token Network crypto plummeted by 2.10% in market value and surged by 13.70% in trading volume in the last day, as per the Coinmarketcap a crypto data analysis website. Its market value is $515,894,604 and its trading volume is $14,522,533. There are 371,908,453 RNDR in circulation. Render Token crypto’s (RNDR) open interest is $18.22 Million. As per Coinglass, another crypto analysis website, it fell by 5.67% in the previous session. The long versus short ratio for 24 hours is 0.7797. The short liquidation is $493.76 versus $44.3 K for the long liquidation.
RNDR coin price in the last three months showed both movements, upward from support of $0.945189 to a high at around $2.927000 and downward by falling from a high during this span.
At the time of publication, the RNDR Coin’s current price is trading around $1.391000.
Therefore, if Render Token fails to maintain the current level, the RNDR coin price could continue to drag downwards and hit the nearest support levels around $1.116963 and $0.945189.
However, if the Coin price sustains the current level and the Render price increases, then it might reach the nearest resistance levels of $1.527006 and $1.770814.
Render Token Price Technical Analysis in the 1-Day Timeframe
At the time of publishing, the RNDR crypto price (GEMINI: RNDR) is trading underneath the 20, and 50-day EMAs (exponential moving averages), which is throwing the RNDR crypto price trend down.
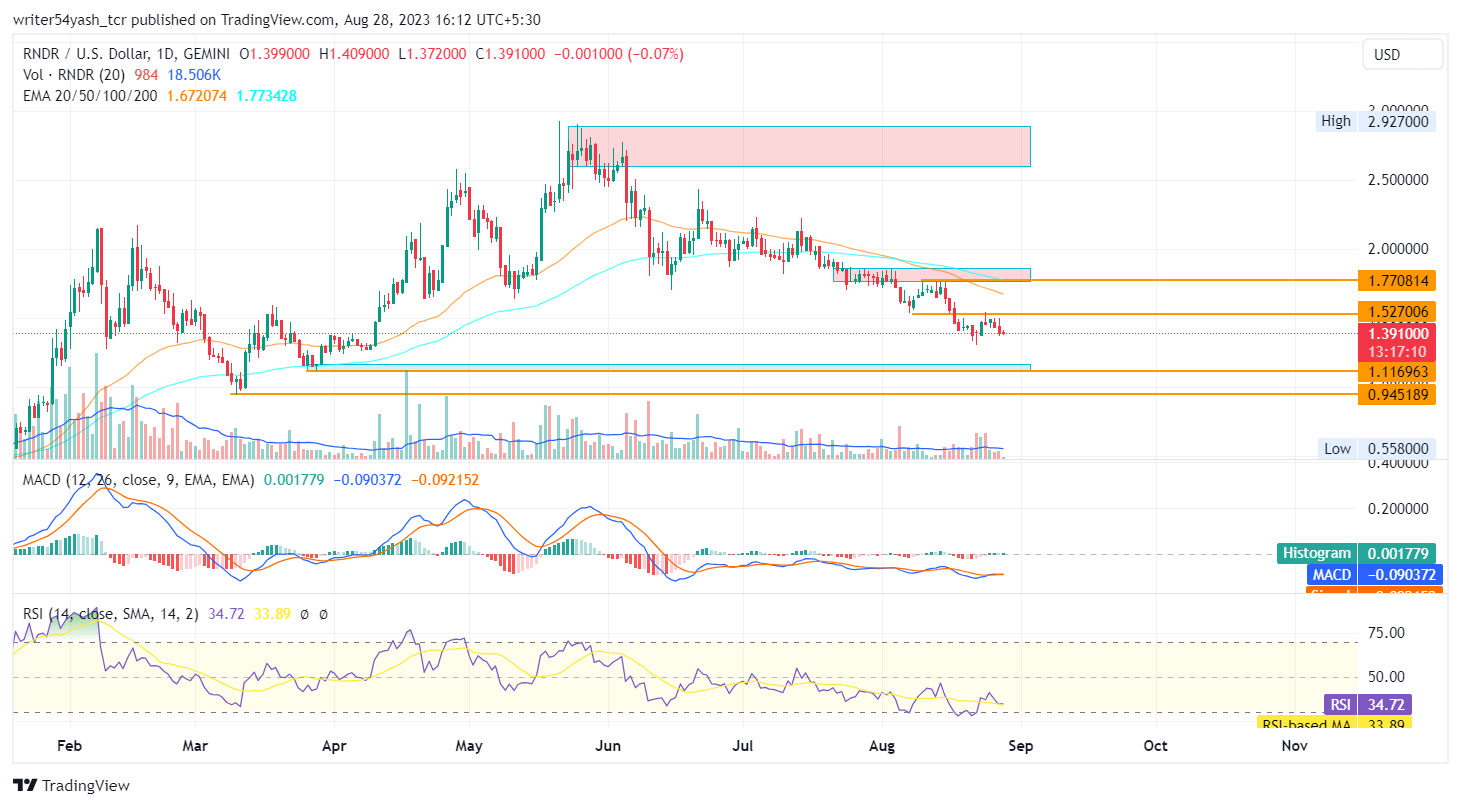
The MACD line at 0.090372 and the signal line at 0.092152 are below the zero line both lines are intermingled to each other highlighting consolidation in the MACD oscillator, suggesting bearish signals. The current value of the RSI is 34.72 points and the 14-day SMA is below the median line at 33.89 points, which indicates bearish sentiments as the RSI is in the oversold zone and highlights bearishness.
Conclusion
RNDR crypto price prediction highlights the bearish sentiments and perspectives regarding RNDR crypto in the daily time frame. Render Token price action highlights consolidation to a bearish view at the time of publishing. Moreover, the technical parameters of the Render Token price suggest the continuation of the downtrend over the daily time frame chart. Major reliable and trustworthy indicators MACD, RSI, and EMA, suggest bearish signals regarding the RNDR crypto price.
Technical Levels:
- Support levels: The nearest support levels are $1.116963 and $0.945189.
- Resistance levels: The nearest resistance levels are $1.527006 and $1.770814.
Disclaimer
In this article, the views and opinions stated by the author, or any people named are for informational purposes only, and they don’t establish the investment, financial, or any other advice. Trading or investing in cryptocurrency assets comes with a risk of financial loss.

Andrew is a blockchain developer who developed his interest in cryptocurrencies while pursuing his post-graduation major in blockchain development. He is a keen observer of details and shares his passion for writing, along with coding. His backend knowledge about blockchain helps him give a unique perspective to his writing skills, and a reliable craft at explaining the concepts such as blockchain programming, languages and token minting. He also frequently shares technical details and performance indicators of ICOs and IDOs.


