
 Home
Home News
News
- 1 WBD stock price slid 3.39% on Friday and closed at $12.27 almost at the recent support at $12.2.
- 2 Warner Bros. Discovery’s stock price (NYSE: WBD) may take a rebound on Monday if the stock manages to get the buying volume.
Discovery Inc. Series (WBD stock) price noted a sharp fall after short selling from the round level of $15 and wiped out nearly 15% in the last 2 weeks losing the gains during the recent quarterly results. The underperforming quarterly results might be one of the factors behind the decline.
The price had been following the rising wedge pattern and tried to gain buyers’ trust near the lower levels and consolidated but the 3.39% drop on Friday’s session showed the selling pressure dominating. The price may take a rebound on Monday’s session if manages to enter the wedge pattern again.

The WBD stock on 3rd August, released its Q2 earnings result, which underperformed the analyst’s estimates. The company reported a revenue of $10.358 Billion below the analyst’s estimates by 79.63 Million. The earnings were reported to be -0.51 Billion underperforming the analyst’s estimates by 45.8%.
The daily chart shows that the price could not sustain above the 50 EMA and 200 EMA showing weakness on the charts. The price may slide more if continues with the momentum and breaks below the $12 level. The analysts maintained a buy rating with a high target of $33, a mean target of $19.25, and a low target of $11.
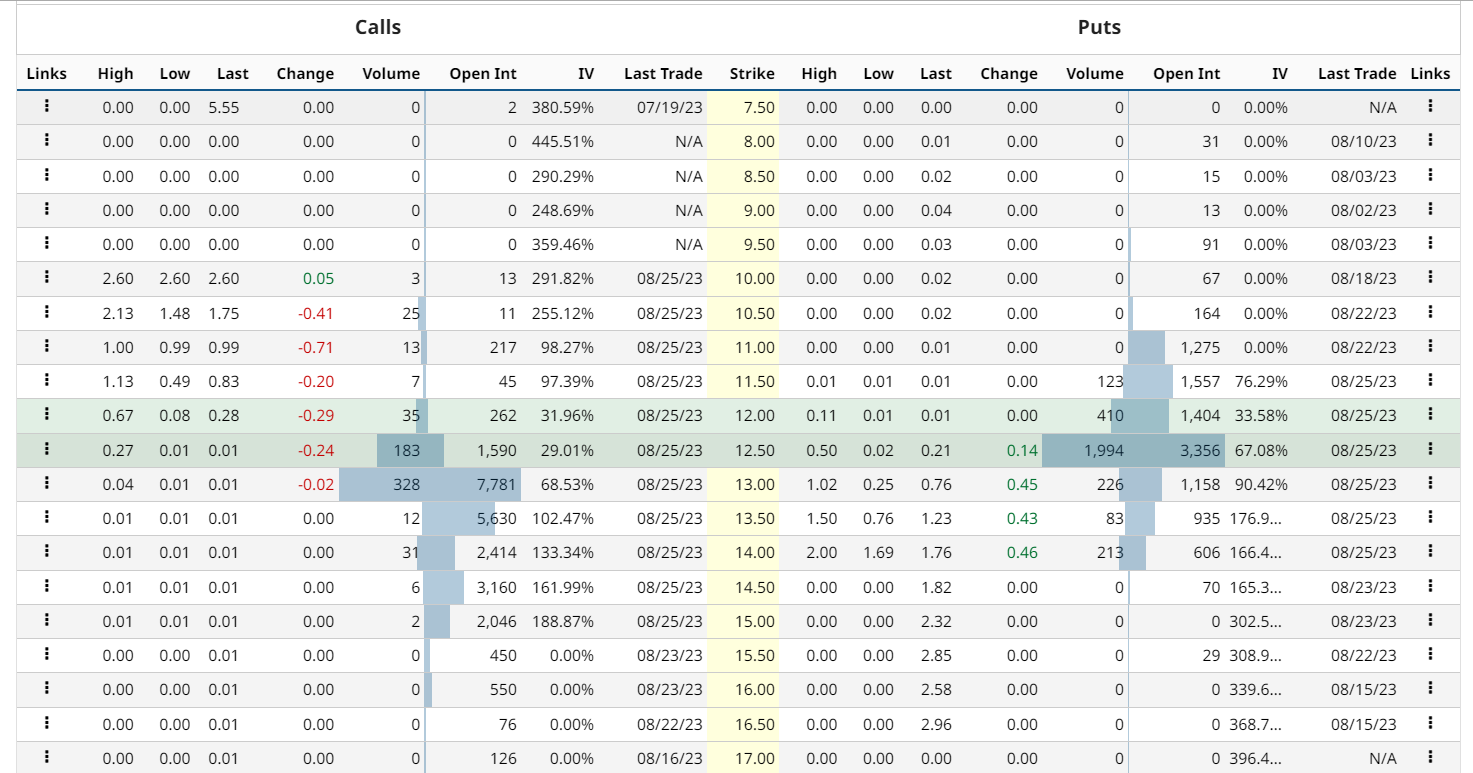
WBD stock option-chain analysis states that the current implied volatility in the market is 46.78% with an increment of 0.04% in the last trading session. The at-the-money strike price has 11,904 open contracts on the put side and 5.051 open contracts on the call side indicating the dominance of buyers at the current level.
WBD Stock Price Shows Breakdown Of Rising Wedge Pattern, Can It Continue?
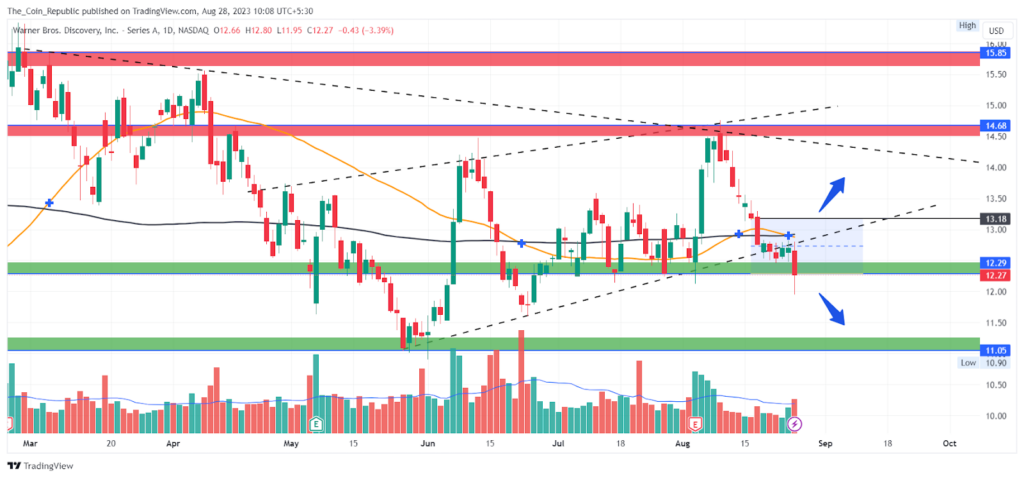
The WBD stock price is showing a breakdown of the recent support and declined 3.39% on Friday’s session. However, It depends on Monday’s session whether the price may continue with the same momentum.
If the price takes a rebound from the current level and recovers in Monday’s session, the price may get the buyer’s support and try to maintain itself in the wedge pattern.
However, if the price fails to get the buyer’s support and continues with the same momentum then the price may slide down to lower support levels near the $11.
The Technical Indicators Signal Weakness Over The Daily Chart
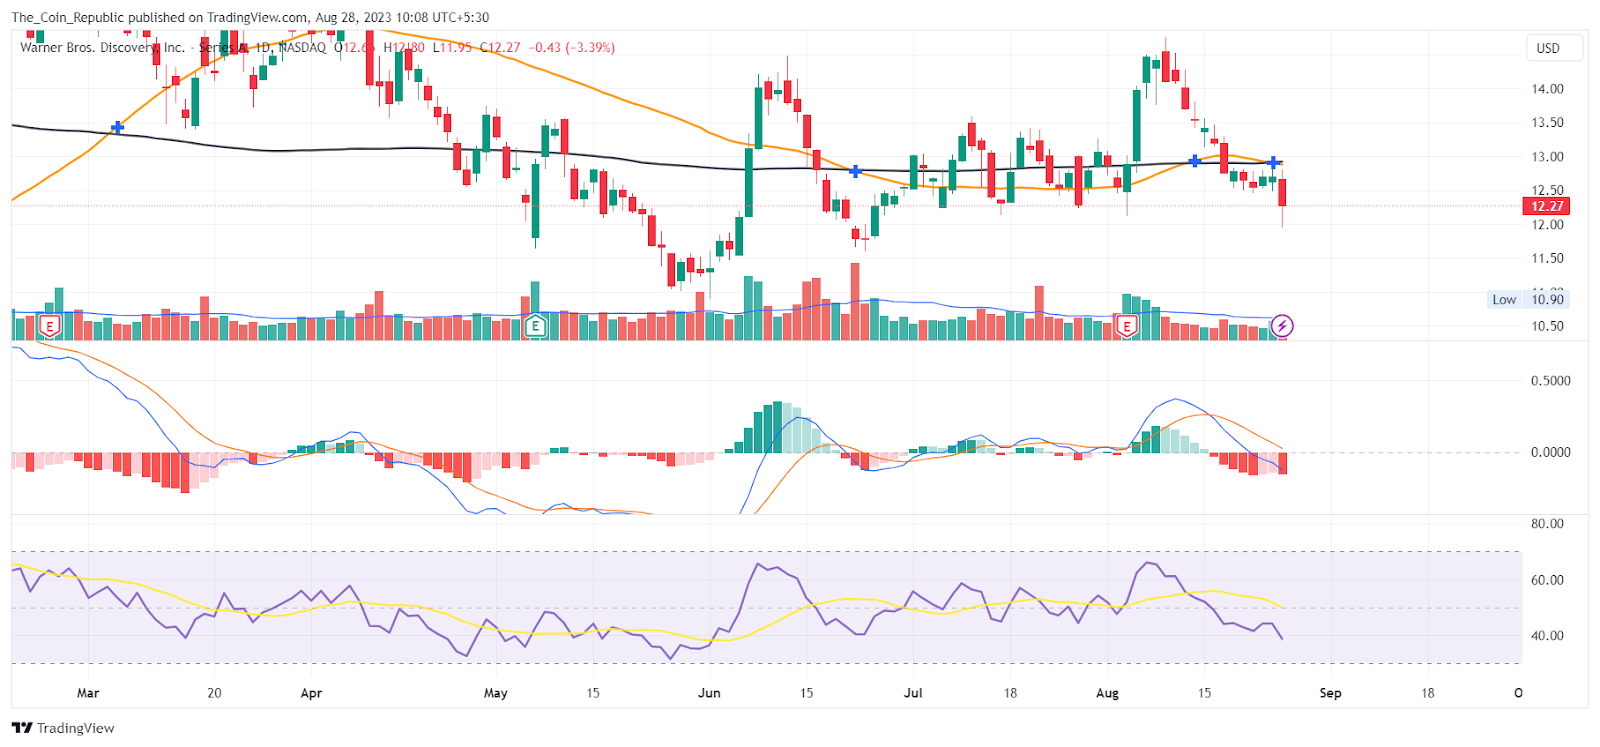
The daily WBD stock price chart shows that the price could not sustain above the key moving averages showing selling pressure from the upper levels. The overall Technical Opinion rating including RSI and MACD is signaling a 40% sell with the average short-term outlook on maintaining the current direction.
Conclusion
Discovery Inc. Series (WBD stock) price dropped 15% in two weeks after a disappointing Q2 earnings result. The price broke below the rising wedge pattern and the key moving averages, showing weakness on the charts. The price may rebound if it enters the wedge pattern again, or slide more if it breaks below the $12 level. The analysts have a buy rating with a high target of $33. The price depends on Monday’s session.
Technical Levels
- Support levels: $12.2 and $11.05.
- Resistance levels: $14.68 and $15.85.
Disclaimer
The views and opinions stated by the author, or any people named in this article, are for informational purposes only and do not establish financial, investment, or other advice. Investing in or trading crypto or stock comes with a risk of financial loss.

With a background in journalism, Ritika Sharma has worked with many reputed media firms focusing on general news such as politics and crime. She joined The Coin Republic as a reporter for crypto, and found a great passion for cryptocurrency, Web3, NFTs and other digital assets. She spends a lot of time researching and delving deeper into these concepts around the clock, and is a strong advocate for women in STEM.


