
 Home
Home News
News
- 1 WDAY stock price increased by 7.60% over the past week and is trading near a vital key resistance.
- 2 Workday Stock Q2 results release was positive, the market responded positively and the current volume is above average.
- 3 Workday, Inc. ( NASDAQ: WDAY) stock’s 52-week price range is $174 – $240.
The Workday stock recently announced its Q2 earnings report on August 24th, 2023, The reported earnings gave a positive surprise of 13.66% from estimated earnings, and reported revenue also is higher by 0.72% from the estimated reports.
Moreover, Workday, Inc. (WDAY) stock market capitalization is $62.086 Billion and the total revenue is $6.198 Billion. The stock’s basic EPS is -$0.48 and the price-to-sales ratio is 9.2.

Workday’s stock price ended at $236.97 on August 25th, 2023, surging by 5.38% from the previous day.
The price action shows that Workday, Inc. ( NASDAQ: WDAY) stock price was in a swift uptrend from June 8th, 2023. It took support at around $45, increasing by roughly 19%, and reached a high of around $239 on August 25th by making higher highs and lows. The continuous streak broke the structure and followed trendline support effectively. Since then, the WDAY stock inclined as support was high and is in an uptrend.
At the time of publication, the WDAY Stock’s current price is trading around $236.97 and it sustained and retracted back at the Fibonacci 50% level around $219, taking support and showing strength on the chart, most probably Workday Inc. ( NASDAQ: WDAY) stock might incline more as buyers have control over WDAY price but a concern might arise as it has reached major supply area, if buyers fail it may drop back to the demand zone, or if demand zone is mitigated then it may consume liquidity around the demand zone and make new lower lows and highs and the new streak of break of structures as selling pressure might increase.
Therefore, if Workday, Inc. fails to maintain the current level, the WDAY price could continue to drag downwards and hit the nearest support levels around $220.93 and $216.76.
However, if the stock price sustains the current level and the Workday price increases, then it might reach the nearest resistance levels of $236.74 and $239.82.
Technical Analysis of WDAY Stock Price in 1-D Timeframe
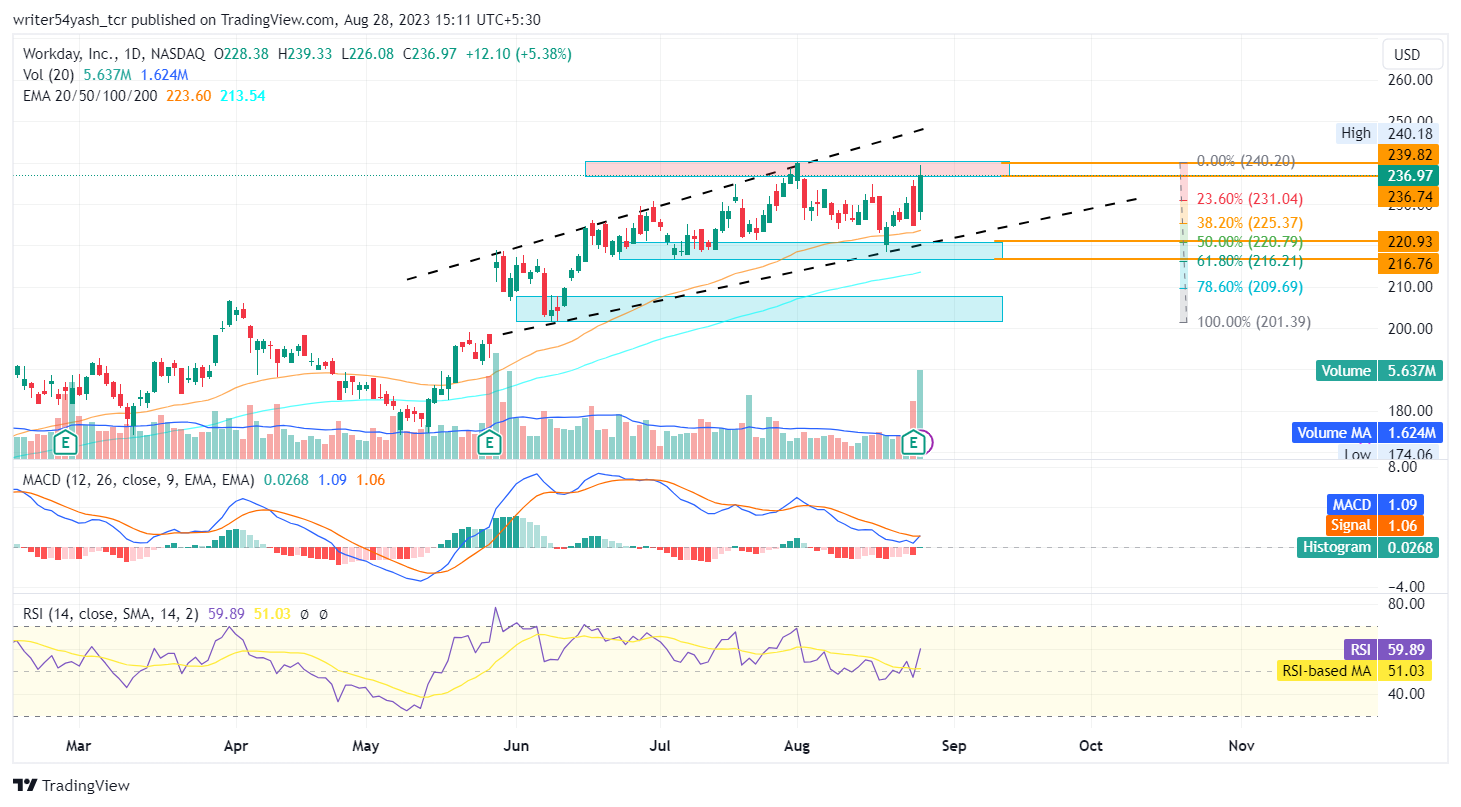
At the time of publishing, Workday, Inc. (NASDAQ: WDAY), the technical indicators for Workday are bullish, as the stock is rising. The daily chart shows that Workday is trading above its 50-day and 100-day moving averages(EMA’s), signaling a bullish trend. Moreover, the relative strength index is around the 59 level, indicating a bullish market sentiment. The MACD is showing a bullish crossover suggesting bullishness in the market.
Summary
Workday, Inc. (NASDAQ: WDAY) stock, highlights that the investors and traders of the stock price are optimistic over the daily time frame(1-D). The price action of WDAY stock also gives bullish and positive views at the time of publishing. The technical analysis tools of Workday stock price also support bullishness. The EMA, RSI, and MACD highlight upward signals and indicate that an uptrend may continue in Workday stock price if key resistance is jumped.
Technical Levels
- Support levels: The nearest support levels for the Workday stock price are $220.93 and $216.76.
- Resistance levels: The nearest resistance levels for the Workday stock price are $236.74 and $239.82.
Disclaimer
In this article, the views and opinions stated by the author, or any people named are for informational purposes only, and they don’t establish the investment, financial, or any other advice. Trading or investing in cryptocurrency assets comes with a risk of financial loss.
Steve Anderson is an Australian crypto enthusiast. He is a specialist in management and trading for over 5 years. Steve has worked as a crypto trader, he loves learning about decentralisation, understanding the true potential of the blockchain.


