
 Home
Home News
News
- 1 The Litecoin crypto’s price increased by 3.48% over the last week and a bullish cross is noticed.
- 2 The price of the LTC crypto is trading at $68.01 and the 52-week range is $47 – $114.
The LTC crypto has not performed well in the last month, decreasing by 26.51% and by 25.09% in the last six months. Litecoin (BITSTAMP: LTC) crypto has a negative year-to-date return of 3.26% and a positive one-year return of 27.97%.
Litecoin crypto surged by 0.48% in market value and plummeted by 51.61% in trading volume in the last 24 hours, as per the Coinmarketcap, a crypto data analysis website. Its market value is $5,017,069,239 and its trading volume is $277,681,439. There are 73,601,539 LTC in circulation.

LTC Crypto Price Technical Analysis in the 1-Day Timeframe
LTC crypto price showed a downward trend for the past month, decreasing by 26.51% during this period and the price fell by making lower lows and highs.
At the time of publication, the LTC crypto price was trading at $68.19 and facing resistance from the trendline and the price boosted upwards from the demand zone around $63 as the orders were present at this level.
Therefore, the LTC crypto price could continue to move downwards and reach the nearest support at $63 and $54. If it fails to maintain the current level.
However, if the LTC crypto price sustains the current level and rises, then it might hit the nearest resistance levels of $71 and $82.
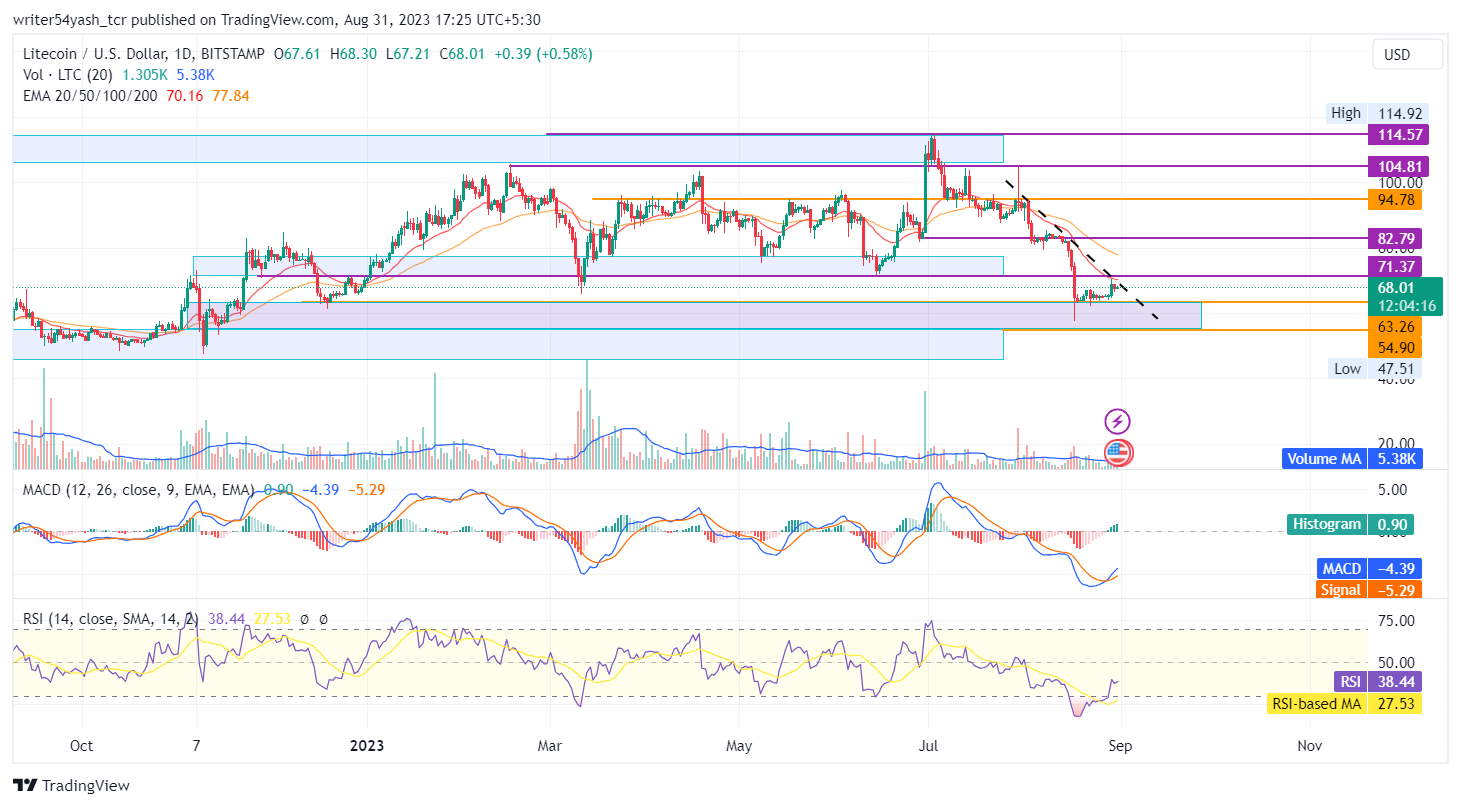
At the time of publishing, the LTC crypto price (BITSTAMP: LTC) is trading below the 20, and 50-day EMAs (exponential moving averages), which supports the LTC crypto price trend.
The MACD line at 4.38 and the signal line at 5.29 are above the zero line and both lines cross each other on a bullish crossover observed in the MACD oscillator. The current value of the RSI is 38.98 points and the 14-day SMA is below the median line at 27.57 points, which indicates bullish sentiments as the RSI took support on 14 SMA and highlighting bullishness.
Conclusion
LTC crypto price prediction highlights the bullish sentiments and perspectives of investors and traders regarding LTC crypto in the daily time frame. Litecoin price action highlights a bullish view at the time of publishing. Moreover, the technical parameters of the Litecoin price suggest the change of trend over the daily time frame chart. Major reliable indicators RSI, MACD, and EMA, give positive signals regarding the LTC crypto price.
Technical Levels:
- Support levels: The nearest support levels are $63 and $54.
- Resistance levels: The nearest resistance levels are $71 and $82.
Disclaimer
In this article, the views and opinions stated by the author, or any people named are for informational purposes only, and they don’t establish the investment, financial, or any other advice. Trading or investing in cryptocurrency assets comes with a risk of financial loss.
Saurav Bhattacharjee is in charge of the Broadcast development team of The Coin Republic.
He has been covering the Metaverse and NFT niche for the past 2 years.
With stellar interviews on his portfolio like Nicehash, Paxful, WallstreetWolvesNFT, Bitholla, Totemfi, EOS.io etc. Saurav has spearheaded the NFT SUPERSTARS AWARD and successfully hosted the first award in 2021.


