
 Home
Home News
News
- 1 Litecoin (LTC) price action exhibits selling pressure on the charts.
- 2 LTC persists in losing the gains and is under the sellers’ regime.
Litecoin (LTC) price chart shows a tremendous fall as it slid below the key moving averages, displaying selling pressure in the past sessions. LTC price action shows a trendline breakdown near $80, leading to a sharp decline toward $60, spoiling the critical support and revealing the entrance of mighty bears in the past trading sessions.
Moreover, LTC price descended below neutrality and is heading toward the seller territory toward $50. Follow-on selling will likely be seen in the upcoming sessions. However, Litecoin price is consolidating. It took a break post immense declines and is approaching the $65 mark. LTC shows a death crossover on the charts and noted a downfall of over 25% this week.
Furthermore, the Litecoin (LTC) trend is negative, and sellers have maintained their extreme momentum and persist in making short buildups. In the past weeks, Litecoin consumed too much spell near $100, where buyers labored to overtake the cluster of $100 but failed, resulting in a slow and steady reversal, which is now getting pace in the form of an intense decline.
At press time, Litecoin price was $65.27 with an intraday gain of 0.21%, showing bearishness. However, the trading volume increased by 5.09% to $324.05 Million, and the pair of LTC/BTC was at 0.00251 BTC. The market cap of LTC is $4.64 Billion. Moreover, analysts downgraded from neutral to sell. Pressure was noted on the charts in the last sessions.
Litecoin Price Action Indicates Seller Dominance
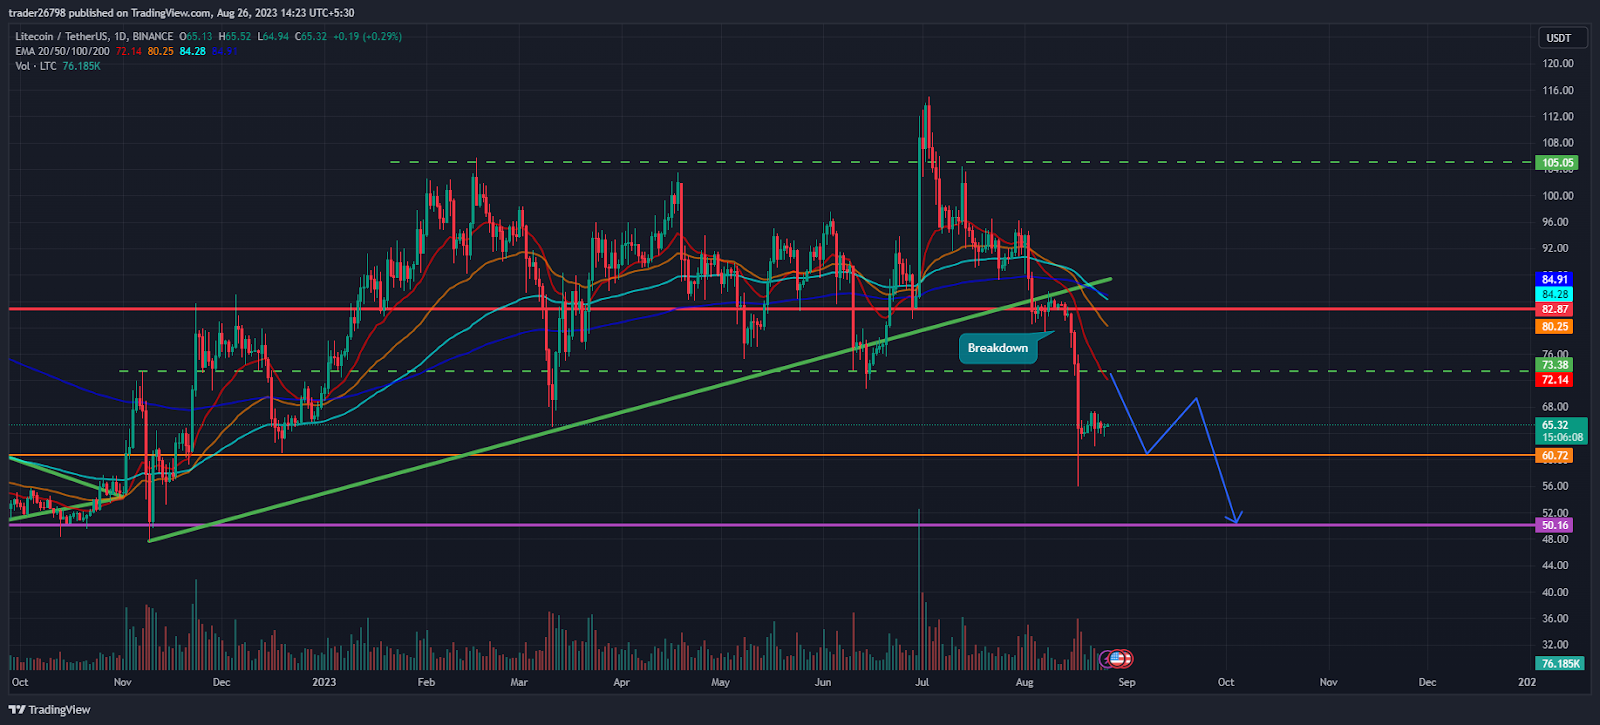
On the daily charts, Litecoin (LTC) broke its critical support levels, and sellers are retrieving their momentum and have now come into action. Moreover, the LTC chart structure is now flipped from neutral to downtrend and indicates further correction toward the trajectory of $50, followed by $40 for the upcoming sessions.
Furthermore, LTC price dipped sharply from 61.8% Fib level to 38.2% level, and is trading below the lower bollinger band, showing a hawkish setback on the charts.
LTC Price Begins Consolidation on Short Term Charts
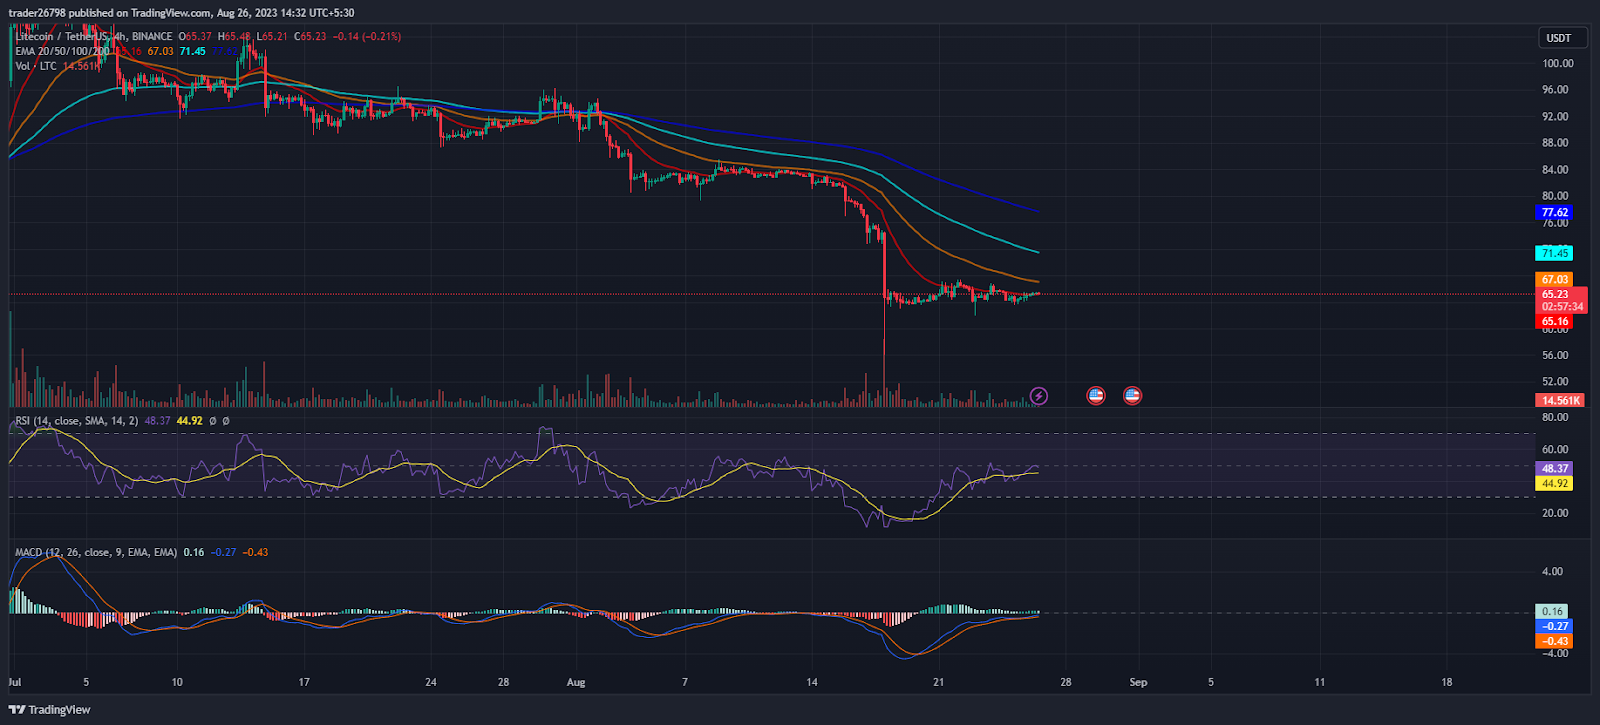
LTC price clung near $65 post breakdown amid low buyer interest in the past sessions. Sellers prevented a pullback attempt by the buyers.
The RSI curve rebounded from the oversold region and is near neutrality, showing a bearish divergence on the charts.
The MACD indicator shows a bullish crossover and green bars on the histogram. However, the negative trend indicates a downfall toward $50 in the following sessions.
Summary
Litecoin (LTC) price chart gives a negative outlook and suggests follow-on selling toward $50 for the subsequent sessions. Sellers are gaining traction and starting to dominate over the past few sessions, suggesting volatility, whereas bulls are starting to unwind their long positions and remain on the back foot.
Technical Levels
Support Levels: $60 and $50
Resistance Levels: $75 and $85
Disclaimer
The views and opinions stated by the author, or any people named in this article, are for informational purposes only, and they do not establish financial, investment, or other advice. Investing in or trading crypto or stock comes with a risk of financial loss.
Steve Anderson is an Australian crypto enthusiast. He is a specialist in management and trading for over 5 years. Steve has worked as a crypto trader, he loves learning about decentralisation, understanding the true potential of the blockchain.


