
 Home
Home News
News
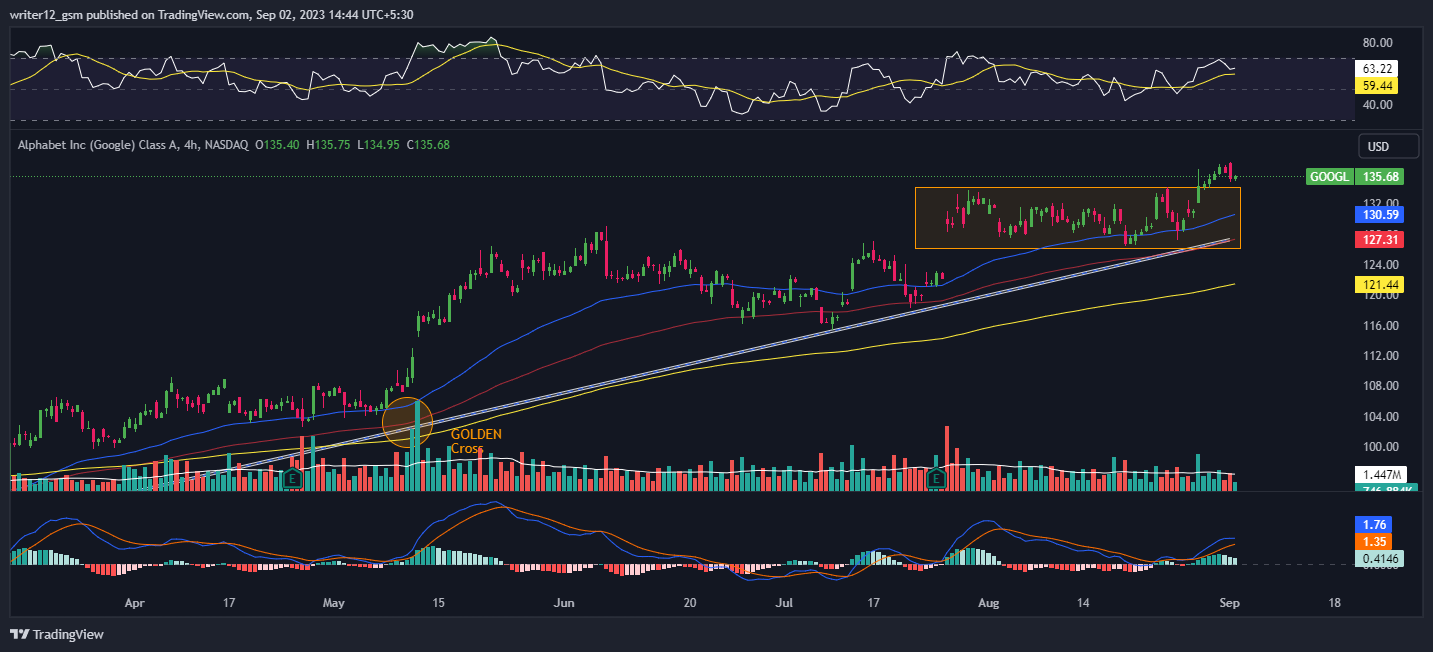
- 1 GOOGL stock broke the consolidation phase and traded at the level of $135.68.
- 2 Alphabet Inc. (NASDAQ: GOOGL) is in an uptrend trading above the key moving averages.
GOOGL stock price is gaining strength and escaped above the 20, 50, 100, and 200-day EMAs showing bullishness in the previous trading sessions. Moreover, the stock recently broke above the consolidation phase. The chart structure showed a roller coaster move in the previous months and was rejected multiple times from the supply range of $134.
Moreover, the lower levels near $126 acted as a support region, and the stock rebounded from there, making the price trade above the biased range.
Likewise, the stock has retested the demand zone near $134, finding support multiple times, and rebounded. Buyers again acquired their muscles and gained momentum to make the $150 mark in the following sessions.
Furthermore, the stock’s trajectory shows that beyond $134, the zone is bullish, and a rally could be seen. At press time, Alphabet Inc. stock is trading at $135.68 with an intraday loss of -0.37%. The chart shows a rise in momentum. Moreover, the intraday trading volume is 21.544 Million. The market cap of Alphabet Inc stock is $1.717 Trillion.
Will GOOGL Stock Price Reach $150?
Alphabet Inc. (NASDAQ: GOOGL) has steadily seen its stock price rise for the past three months, gaining 9.41% and gaining 46.69% in the six months. Currently, Alphabet Inc. stock is trading at $135.66 and has been trying to hold on to this level after an unexpected breakout in price.
Presently, Alphabet Inc. (NASDAQ: GOOGL) is trading above the 20, 50, 100, and 200-day DMAs (Daily moving averages), which are supporting the price momentum. However, if more buying volume adds up, then the price might support bullish momentum by making higher highs and new highs. Hence, the GOOGL price is expected to move upward giving bullish views over the daily time frame chart.
The present value of RSI is 63.22 points. The 14 SMA is above the median line at 59.44 points which indicates that the GOOGL stock is bullish trend. The MACD line at 1.76 and the signal line at 1.35 are above the zero line. A bullish crossover is observed in the MACD which indicates strength in the momentum of the Alphabet Inc. stock price.
Summary
On the daily charts, GOOGL stock broke the prolonged consolidation pattern and gave a breakout. Currently. analyst predicts GOOGL stock can reach the level of $150 in the near future as bulls support the price. Moreover technical indicators like MACD, RSI, and EMAs point to bullishness in the stock. One must wait until the price of the share completes its retest and head towards the next level. Nevertheless, investors and traders should avoid FOMO by waiting for proper setups before moving forward.
Technical Levels
- Support Levels: $129.03 and $121.90
- Resistance Levels: $140.65 and $145.14
Disclaimer
The analysis provided in this article is for informational and educational purposes only. Do not rely on this information as financial, investment, or trading advice. Investing and trading in stock involves risk. Please assess your situation and risk tolerance before making any investment decisions.

Nancy J. Allen is a crypto enthusiast, with a major in macroeconomics and minor in business statistics. She believes that cryptocurrencies inspire people to be their own banks, and step aside from traditional monetary exchange systems. She is also intrigued by blockchain technology and its functioning. She frequently researches, and posts content on the top altcoins, their theoretical working principles and technical price predictions.


