
 Home
Home News
News
- 1 The Quant crypto’s price decreased by 2.23% over the last week and it is trading below all major EMA’s.
- 2 The price of the QNT crypto is trading at $99.570000 and the 52-week range is $95 – $161.
Quant crypto plummeted by 0.74% in market value and plummeted by 15.18% in trading volume in the last 24 hours, as per Coinmarketcap, a crypto data analysis website. Its market value is $1,196,402,121 and its trading volume is $11,897,106. There are 12,072,738 QNTs in circulation. Quant coin’s (QNT) open interest is $6.29 Million. As per Coinglass, another crypto analysis website, it fell by 2.58% in the previous session. The long versus short ratio for 24 hours is 1.0173. The total number of short positions added in the last 24 hours is $267.65 K against longs of $1.60 K.
The QNT crypto has not performed well in the last month, decreasing by 7.80% and by 22.42% in the last six months. Quant (GEMINI: QNT) crypto has a negative year-to-date return of 5.26% and a positive one-year return of 4.57%.
QNT Crypto Price Technical Analysis in the 1-Day Timeframe
QNT crypto price showed a downward trend for the past six months, decreasing by 22.42% during this period and the price fell by making lower lows and highs.
At the time of publication, the QNT crypto price was trading at $99.570000 and took resistance from the trendline. The price stepped down from 50.00% Fibo levels on April 14th, 2023, and declined drastically. Now, to rise above, QNT needs to surpass the trendline first which seems difficult as per the current scenario, and the market trend will only change upwards when it surpasses the Fibo 38.20% level as a change of character will happen after it jumps this level.
Therefore, if it fails to maintain the current level, the QNT crypto price could continue to move downwards and reach the nearest support at $95 and $91.
However, if the QNT crypto price sustains the current level and rises, then it might hit the nearest resistance levels of $105 and $112.
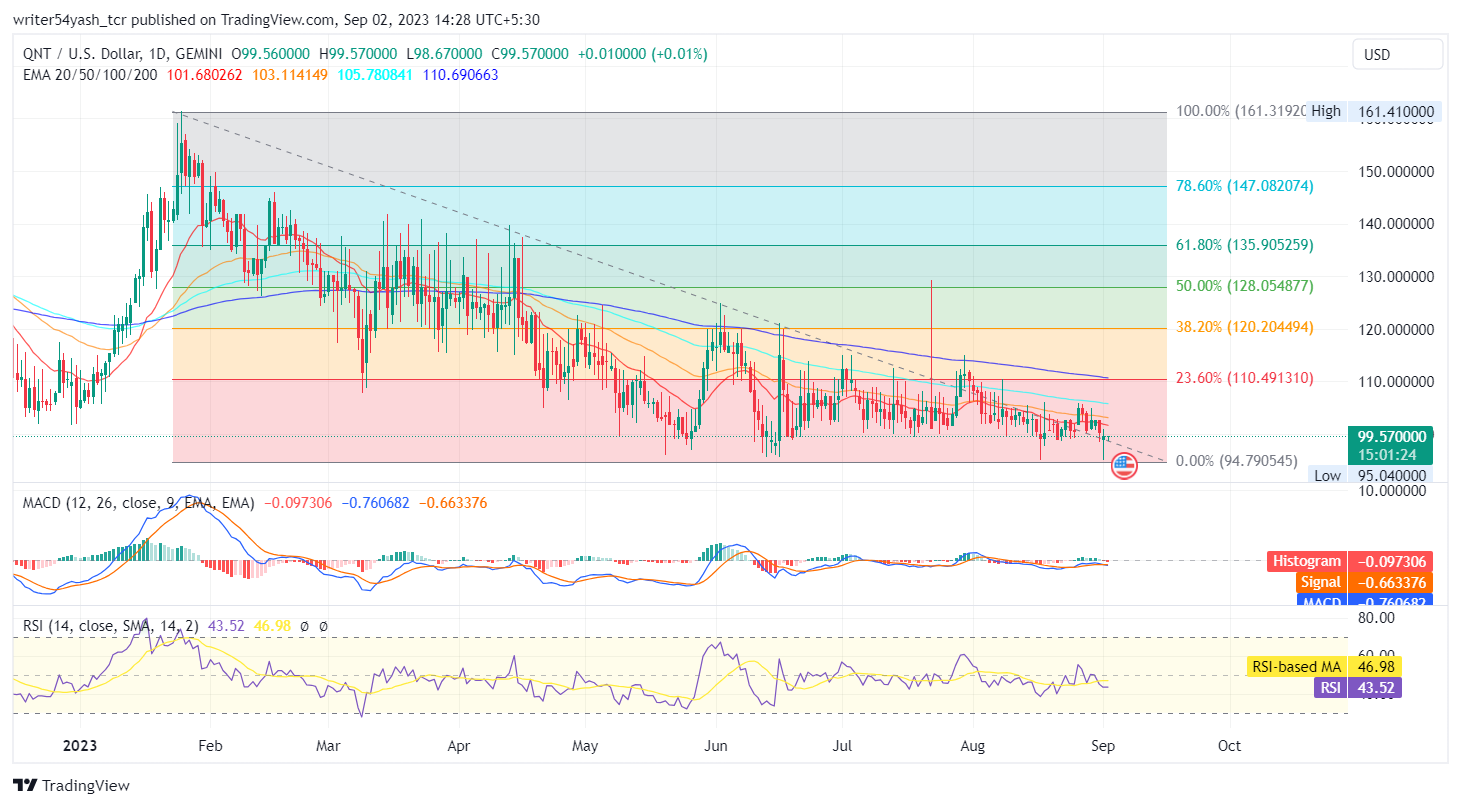
At the time of publishing, the QNT crypto price (GEMINI: QNT) is trading below the 20, and 50-day EMAs (exponential moving averages), which are rejecting the QNT crypto price trend.
The MACD line at 0.760682 and the signal line at 0.663376 are below the zero line. Both lines cross multiple times on each other each time the histogram gap is decreased even further highlighting consolidation in the QNT price in the MACD oscillator. The current value of the RSI is 43.52 points and the 14-day SMA is below the median line at 46.98 points, which indicates consolidation to bearish sentiments as the RSI is at the median line in the market for the QNT crypto and highlights neutrality to bearishness.
Conclusion
QNT crypto price prediction highlights the neutral to bearish sentiments and perspectives of investors and traders regarding QNT crypto in the daily time frame. Quant price action suggests a no view at the time of publishing. Moreover, the technical parameters of the Quant price suggest the continuation of the consolidation to bearishness over the daily time frame chart. Major reliable indicators RSI, MACD, and EMA, give neutral to bearish signals regarding the QNT crypto price.
Technical Levels:
- Support levels: The nearest support levels are $95 and $91.
- Resistance levels: The nearest resistance levels are $105 and $112.
Disclaimer
In this article, the views and opinions stated by the author, or any people named are for informational purposes only, and they don’t establish the investment, financial, or any other advice. Trading or investing in cryptocurrency assets comes with a risk of financial loss.

With a background in journalism, Ritika Sharma has worked with many reputed media firms focusing on general news such as politics and crime. She joined The Coin Republic as a reporter for crypto, and found a great passion for cryptocurrency, Web3, NFTs and other digital assets. She spends a lot of time researching and delving deeper into these concepts around the clock, and is a strong advocate for women in STEM.


