
 Home
Home News
News

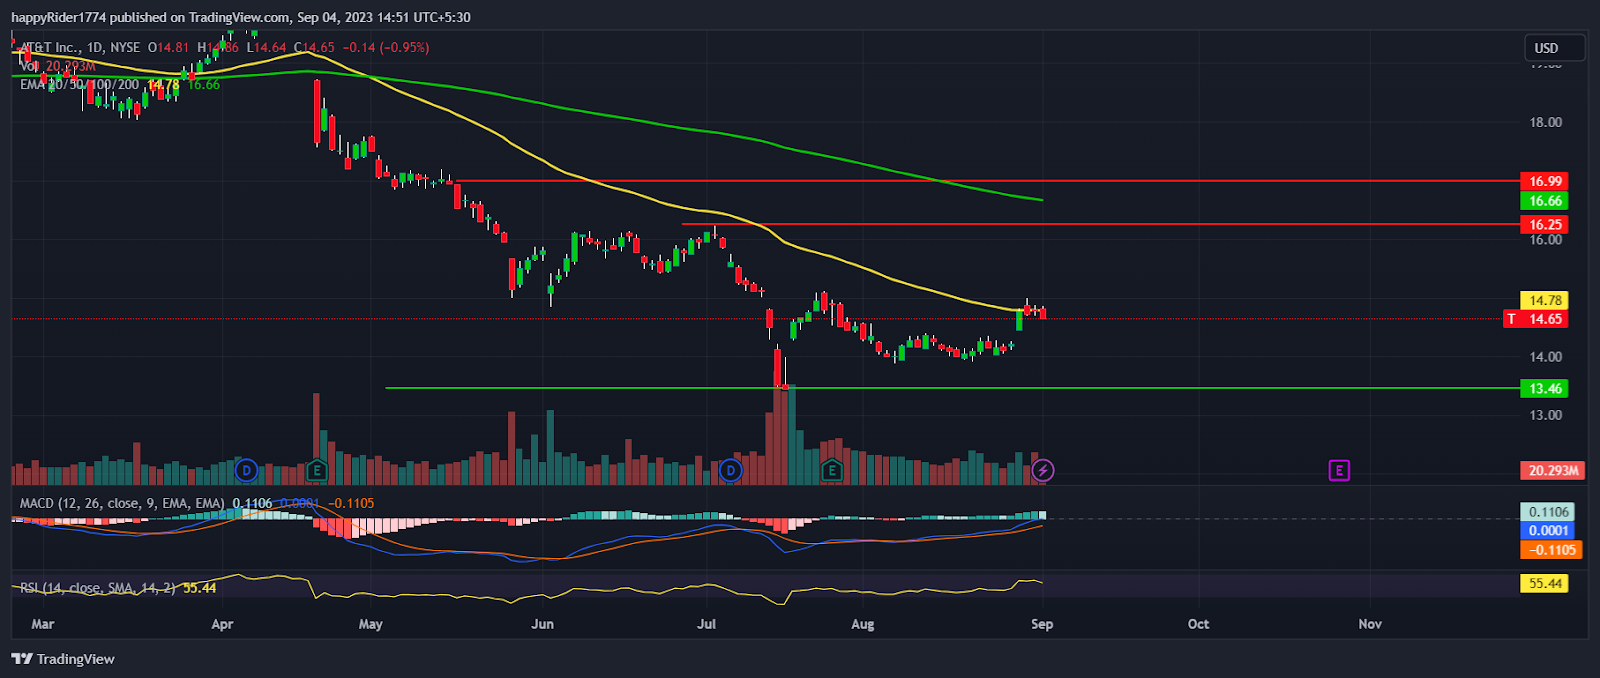
- 1 AT&T stock price (NYSE: T) defended $14 support and showed a minor bounce.
- 2 T stock price is trying to climb above the 50-day EMA to reverse the trend.
- 3 AT&T Inc. stock price is in a downtrend.
AT&T Inc., T stock price defends $14.00 level and rises 3.83% in the previous week. It attempts to break the $15.00 hurdle but the confirmation is still awaited.
AT&T stock price is trying to climb above the 50-day EMA to reverse the short-term trend in favor of bulls. However, the positional trend is still bearish till prices trade below the 200-day EMA.

In the mid of July, T stock price witnessed a massive sell-off and prices broke the $14.00 support. But, sellers failed to give the follow through and prices bounced back sharply. It shows that bulls are active near $14.00 and downside risk is low.
In August, T stock price consolidated in a narrow range between $14 to $15 and formed a short-term base. Recently, prices seem to be preparing for another attempt to break the higher range. If buyers succeed then more upward momentum is possible.
The broader market indices like Dow Jones, Nasdaq 100, and S&P, all are recovering. So, if the recovery continues then AT&T stock might also be positively impacted.
Will T Stock Price Continue the Recovery?
T stock price is showing initial signs of a bullish trend reversal. But the confirmation will come when buyers are able to sustain the price above the 50-day EMA.
Presently, AT&T stock price closed the previous session at $14.65 with an intraday decline of -0.95%. Buyers are getting active so the short-term recovery might continue for a few weeks.
Till T stock price holds the $13.46 support the bulls will remain active and try to push the price to $16.00. The technical analysis suggests that T stock price is in the initial phase of recovery. So, it’s going to be difficult for the buyers to break the hurdles.
Will AT&T Stock Price Give the Follow-Up Momentum
AT&T stock price (NYSE: T) formed a bullish candle on the weekly time frame. It will be interesting to see whether the buyers are able to give the follow-up momentum.
The MACD curve slopes upward and tries to trade above the zero line. The histogram bar is green indicating bulls are returning back to track. The RSI at 55 slopes sideways denoting prices might continue to consolidate for some time before continuing the rally.
Conclusion
AT&T Inc., T stock price defended the $14.00 level and showed a minor bounce. Buyers are getting active and trying their best to reverse the short-term trend.
The technical analysis suggests AT&T stock price is recovering but it’s going to be difficult for the buyers to break $16.
Technical levels
- Resistance levels: $15.00 and $16.25
- Support levels: $13.46 and $13.00
Disclaimer
The views and opinions stated by the author, or any people named in this article, are for informational purposes only. They do not establish financial, investment, or other advice. Investing in or trading crypto assets comes with a risk of financial loss.

Adarsh Singh is a true connoisseur of Defi and Blockchain technologies, who left his job at a “Big 4” multinational finance firm to pursue crypto and NFT trading full-time. He has a strong background in finance, with MBA from a prestigious B-school. He delves deep into these innovative fields, unraveling their intricacies. Uncovering hidden gems, be it coins, tokens or NFTs, is his expertise. NFTs drive deep interest for him, and his creative analysis of NFTs opens up engaging narratives. He strives to bring decentralized digital assets accessible to the masses.


