
 Home
Home News
News
- 1 TGT stock price faced a breakdown of the consolidation phase in the past sessions.
- 2 Buyers are losing strength and unwinding their long positions.
Target Corporation (TGT stock) price shows a downtrend and a volatile chart structure for the past sessions. Moreover, the price hovers inside the narrow congestion zone and shows a bearish chart structure. Furthermore, the TGT stock slowly & steadily slipped the gains and lost over 28% in the past three months.
TGT stock price action favors the bears and suggests a further downfall, which may lead the stock toward $100 in the upcoming sessions. The trend is negative, and buyers persist in unwinding their positions because of the intense selling pressure, whereas sellers persist in adding short positions for the past sessions.
TGT stock price shows a volatile chart structure, and the price waited for a further move post-breakdown. However, the price re-entered the range and tried to retain the swing of $130 near the upper neckline. Moreover, the technicals suggest a negative outlook, and if follow-on selling arises, it will fall toward $100. If the price sustains near the cluster of $120, a bounce can be seen to retest the upper neckline of $140 soon. Conversely, primary support is near $115, which, if it breaks, leads to revisiting the round mark of $100.
At press time, TGT stock price is trading at $125.52 with an intraday drop of 0.81%, showing bearishness on the charts. Moreover, the trading volume remained average at 2.997 Million, and the market cap is $57.941 Billion. Moreover, Analysts maintained a neutral rating with a yearly target price of $149.88.
Target Corp. engages in the operation and ownership of general merchandise stores. It offers food assortments, including perishables, dry groceries, dairy, and frozen items. The company was founded by George Draper Dayton in 1902 and is headquartered in Minneapolis, MN.
TGT Stock Shows Narrow Range Moves On Daily Charts
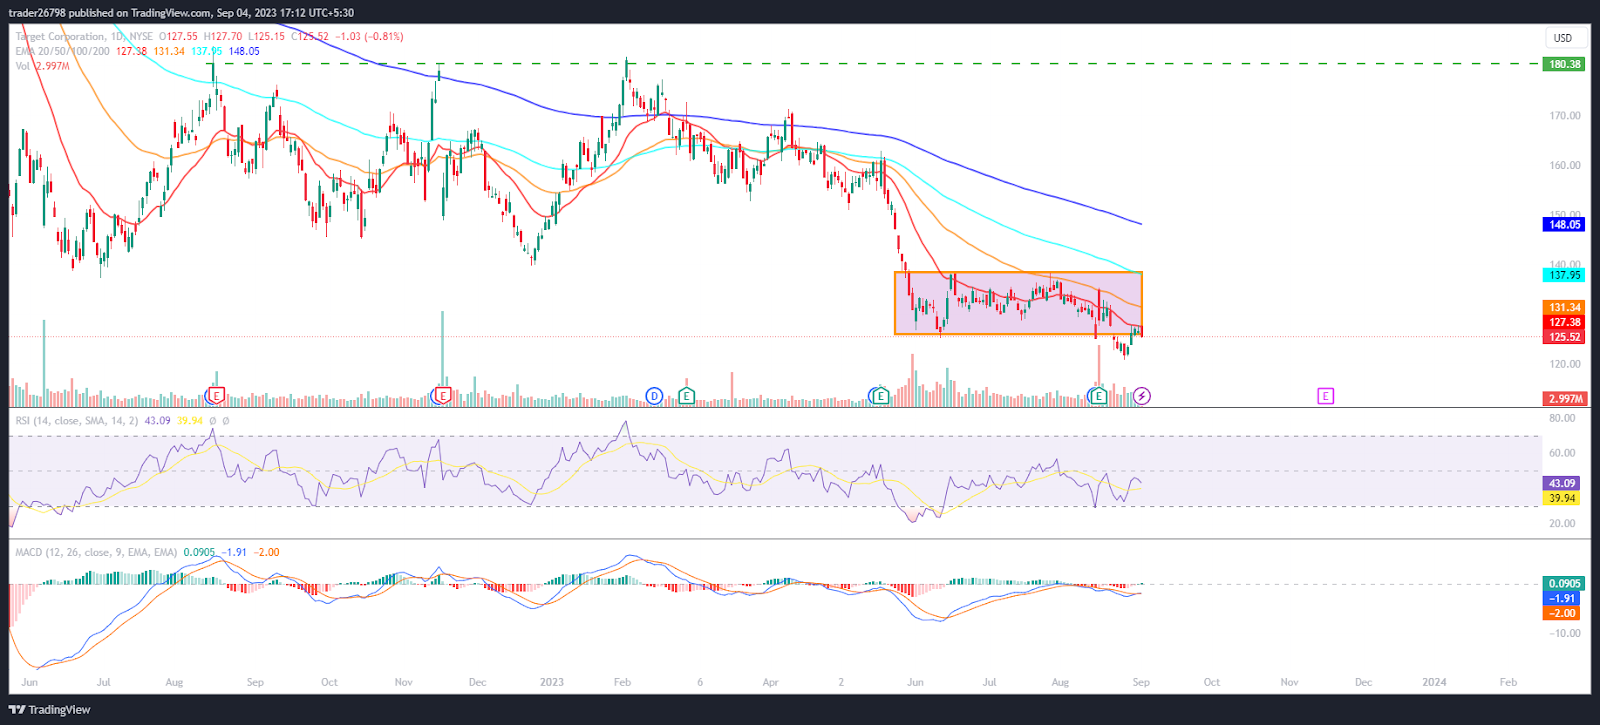
On the daily charts, TGT stock price traded in a narrow congestion range and stayed below neutrality, showing a negative outlook for the past sessions. Moreover, the price trades below the 38.2% Fib level and the mid-Bollinger band, showing a weak chart structure.
The RSI curve stayed below the neutrality and showed a negative crossover, suggesting a range-based move for the upcoming sessions.
The MACD indicator showed a convergence of the MA line with the signal line, showing a neutral chart structure on the charts.
Summary
Target stock (TGT) price persisted in a downtrend and stayed in a narrow congestion zone below the cluster of $150. Moreover, the price action suggests a follow-up selling will arise and may revisit the strong support range near $110 in the upcoming sessions. Bears persisted in making short positions and looked strong, whereas buyers stayed cautious and lost their grips for the past sessions.
Technical Levels
Support Levels: $120 and $110
Resistance Levels: $135 and $150
Disclaimer
The views and opinions stated by the author or any people named in this article are for informational purposes only, and they do not establish financial, investment, or other advice. Investing in or trading crypto or stock comes with a risk of financial loss.

Nancy J. Allen is a crypto enthusiast, with a major in macroeconomics and minor in business statistics. She believes that cryptocurrencies inspire people to be their own banks, and step aside from traditional monetary exchange systems. She is also intrigued by blockchain technology and its functioning. She frequently researches, and posts content on the top altcoins, their theoretical working principles and technical price predictions.


