
 Home
Home News
News

- 1 DOGE coin price has shown a narrow range of moves in the past trading sessions.
- 2 Buyers are putting in efforts but still need momentum to surpass the 20-day EMA.
Dogecoin (DOGE) price shows a narrow range consolidation moves and hovers below the cluster of $0.07000, indicating a mild negative outlook. However, the price was trading near neutrality and did not indicate a fall, but due to the short buildup activity, buyers’ uncertainty was there, and the price remained in the congestion zone. Moreover, the price action shows a volatile chart structure where the price failed to surpass the primary hurdle of $0.07000 and trading below it.

DOGE price shows a reversal and seller control in the past sessions, suggesting a volatile structure. However, the price action shows that if the price sustains below the 20-day EMA, DOGE may revisit the support of $0.06000.

The technicals suggest a follow-on selling got pace below the swing of $0.06200, and bears will get strength. Moreover, the buyers are also trying to pull back and accumulate to revisit the 50-day EMA swing near $0.06800. Furthermore, the price is close to the lower trendline and may attain a bounce in the following sessions.
At press time, the DOGE coin price is trading at $0.06410 with an intraday gain of 1.30%, showing neutrality on the charts. Moreover, the trading volume increased by 2.11% to $192.85 Million, and the market cap is $9.03 Billion. However, the pair of DOGE/BTC is at 0.00000025 BTC. Moreover, Analysts maintain a neutral rating, and technicals suggest a rebound in the upcoming sessions.
DOGE Remained In Congestion Zone On Daily Charts
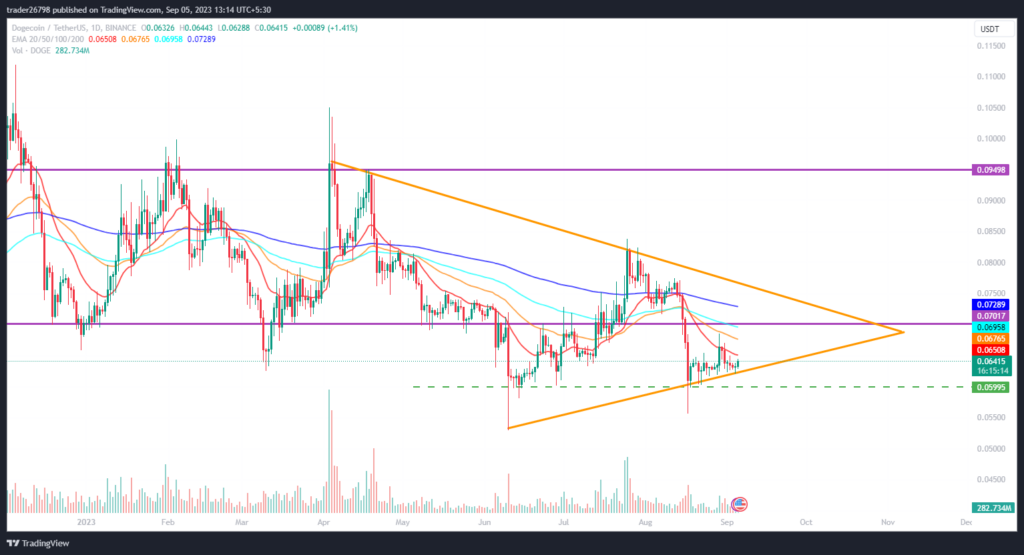
On the daily charts, the DOGE price shows a symmetrical triangle pattern and may get a bounce toward the upper trendline of $0.07000 in the following sessions. Moreover, the price is near the crucial support zone and indicates buyers’ grip. Furthermore, the chart structure shows seller dominance and bears persisted in making short buildup activity.
What Technical Indicators Say?
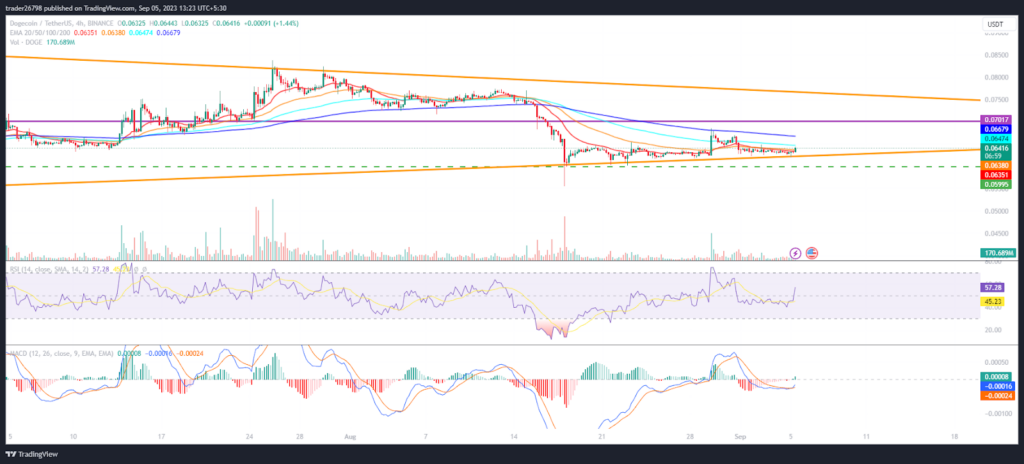
On the 4-hour charts, the DOGE coin price suggests a short-term bounce and may revisit the cluster of $0.07000. Moreover, the price action shows that the DOGE coin price is hovering and consolidating below the 20-day EMA.
The RSI curve shows a rebound from the oversold region, and a positive crossover suggests a bounce in the following sessions.
The MACD indicator showed a bullish crossover, and forming the green bars on the histogram suggests a positive crossover.
Summary
DOGE coin price shows a narrow range consolidation and stayed below the 20-day EMA for the past sessions. Furthermore, the chart structure shows a bearish outlook and persists in rejection near the upper trendline of the symmetrical triangle pattern on the charts. The upper trajectory is near $0.07000, which, if surpassed, may lead to a retest of the swing of $0.07500, whereas if it breaks below $0.06300, it will lead to revisiting the swing of $0.06000.
Technical Levels
Support Levels: $0.06300 and $0.06000
Resistance Levels: $0.06800 and $0.07000
Disclaimer
The views and opinions stated by the author or any people named in this article are for informational purposes only, and they do not establish financial, investment, or other advice. Investing in or trading crypto or stock comes with a risk of financial loss.
Mr. Pratik chadhokar is an Indian Forex, Cryptocurrencies and Financial Market Advisor and analyst with a background in IT and Financial market Strategist. He specialises in market strategies and technical analysis and has spent over a year as a financial markets contributor and observer. He possesses strong technical analytical skills and is well known for his entertaining and informative analysis of the Financial markets.


