
 Home
Home News
News
- 1 Quant price (QNT) is down by 0.87% in the past 24 hours and is currently trading at $97.54.
- 2 Quant (QNT) price dropped below the key moving average of 50 and 200 EMA.
- 3 QNT’s price is consolidating above the $95 round level.
The price prediction of the Quant over the daily chart (QNT) shows that the coin price has been steadily declining for the last 6 months losing more than 16% of its market capitalization. The price has been in a declination phase after a hike in January 2023.
The daily chart shows that the QNT crypto price has been declining continuously after hitting a high of $163 in January. The bulls tried to hold the price above the key moving averages but the heavy short-selling from the upper levels led to a continuous decline and the price kept on declining forming lower highs.
The price also seemed to suffer multiple rejections from an upper trendline resistance.
Currently, the QNT price is consolidating near the previous demand zone of $95.
Quant Token (QNT) is a project that connects different blockchains and networks globally, without compromising their speed and compatibility. It is the first to create a blockchain operating system that solves the interoperability problem.
Quant Price Declined Suffering Rejection From An Upper Trendline
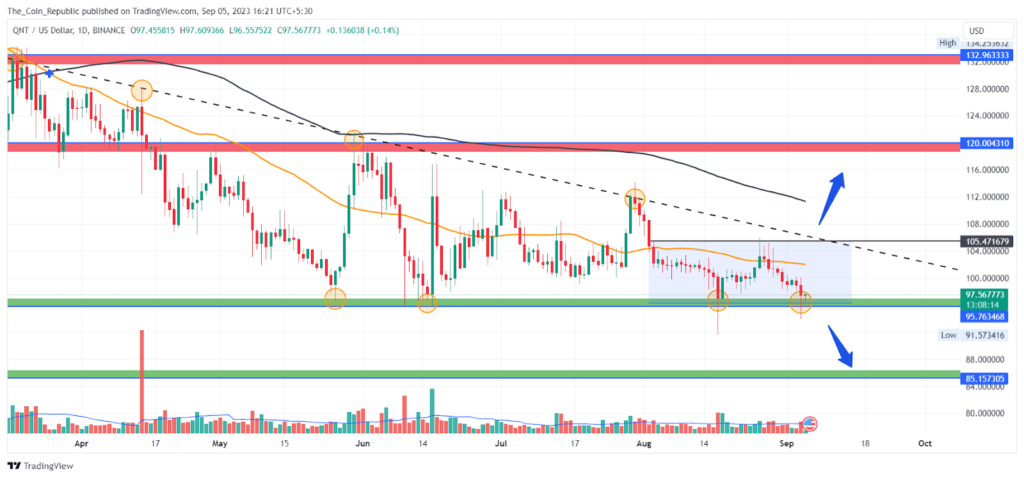
The Quant price is currently trading at $97.75 and consolidating in a range with support at $95 and resistance at $106. The Bulls and Bears had a tough fight for the last 30 days still none seems to be dominating. The price trend is indecisive until it maintains in the range.
The breakdown of the range may wipe out another 8% of the market capitalization and drag the QNT price down to the $85 level.
However, if more buyers accumulate at the lower levels and the price manages to break above $106 then it may gain 10-12% to reach the upper level of $120.
Technical Indicators Showing Indecisive Trend At The Moment

MACD lines have made a bearish crossover. Also, histogram bars are being formed below the mean line with increasing height showing that the bearish sentiment dominates the market.
The EMA analysis shows that the QNT price dropped below the 50 and 200 EMA Indicating weakness on the charts.
At the time of publishing, the RSI value of the QNT token is 36.12 and that of the SMA line is 45.7. RSI is declining indicating the selling pressure dominating.
Conclusion
The Quant price has been falling for six months after reaching $163 in January. It has faced rejections from an upper trendline and dropped below the key moving averages. It is now trading in a range between $95 and $106, with no clear trend. A break below $95 may lead to an 8% loss, while a break above $106 may result in a 10-12% gain.
Technical Levels
- Support levels: $95.7 and $85.1.
- Resistance levels: $120.03 and $132.96.
Disclaimer
The views and opinions stated by the author, or any people named in this article, are for informational purposes only and do not establish financial, investment, or other advice. Investing in or trading crypto or stock comes with a risk of financial loss.

Andrew is a blockchain developer who developed his interest in cryptocurrencies while pursuing his post-graduation major in blockchain development. He is a keen observer of details and shares his passion for writing, along with coding. His backend knowledge about blockchain helps him give a unique perspective to his writing skills, and a reliable craft at explaining the concepts such as blockchain programming, languages and token minting. He also frequently shares technical details and performance indicators of ICOs and IDOs.


