
 Home
Home News
News
- 1 RSG stock price shows selling pressure and faced rejection from $160.
- 2 Buyers are losing strength and unwinding their positions from the last sessions.
Republic Services (RSG stock) price shows selling pressure and failed to extend the momentum, resulting in slippage below $150 in the last trading sessions. Moreover, the price action shows a trendline breakdown and indicates a negative outlook; if the price slips below the 100-day EMA, the fall may extend toward the immediate support of the 200-day EMA near $140. Furthermore, the technicals suggest short buildup and seller interaction in the past sessions. However, the buyers tried to halt the gains and put efforts to reach $200 soon.
RSG stock price shows a reversal from the top, and a bearish double-top pattern shows a negative outlook for the upcoming sessions. Moreover, the pattern suggests a follow-up selling and may retest the 200-day EMA soon.

Republic Service’s share price failed to extend the momentum and made an inverted hammer candlestick showing that buyers tried to surpass the neckline of $160. Still, sellers maintained a strong grip and threw back the bulls, continuing the fall.
At press time, RSG stock price is trading at $144.90 with an intraday gain of 0.53%, showing neutrality on the charts. Moreover, the trading volume increased by 1.98% to 998.966K, and the market cap is $45.836 Billion. However, Analysts maintained a buy rating with a yearly target price of $165.58, suggesting a strong growth outlook for the upcoming sessions.
Republic Services, Inc. engages in the provision of environmental services. It operates through the following segments: Group 1, Group 2, and Group 3.
The Group 1 segment focuses on recycling and solid waste in geographic areas in the western United States.
The Group 2 segment includes the recycling and solid waste business in geographic areas located in the southeastern, mid-western, and eastern seaboard of the United States.
The Group 3 segment includes environmental solutions businesses in geographic areas across the United States and Canada.
RSG Stock Price Shows Breakdown On Daily Charts
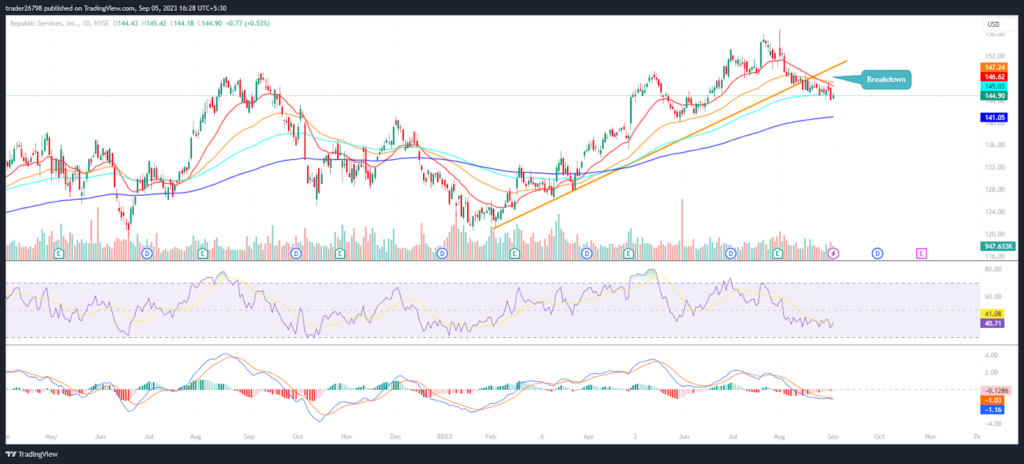
On the daily charts, RSG stock price shows a trendline breakdown and made a double top pattern, showing seller interest and initiation of short buildup in the past sessions. Furthermore, the primary support of $150 was broken, suggesting that buyers are losing their grip and failing to hold the gains. Moreover, the price slipped below the 61.8% Fib level and the Bollinger band, showing sellers’ control in the past sessions.
The RSI curve hovers near the oversold region and shows a negative crossover, indicating a volatile chart structure on the charts.
The MACD indicator showed a convergence of the MA line with the signal line showing a bearish chart structure and may head toward the 200-day EMA soon.
Summary
Republic Services stock (RSG stock) price shows a breakdown of the double top pattern and slipped below the trendline of $150, indicating sellers’ interest in the past sessions. Moreover, the price action shows that bulls failed to surpass the neckline of $160 and showed a strong rejection from the supply region, and distribution was noted on the charts.
Technical Levels
Support Levels: $140 and $130
Resistance Levels: $150 and $165
Disclaimer
The views and opinions stated by the author or any people named in this article are for informational purposes only, and they do not establish financial, investment, or other advice. Investing in or trading crypto or stock comes with a risk of financial loss.

Adarsh Singh is a true connoisseur of Defi and Blockchain technologies, who left his job at a “Big 4” multinational finance firm to pursue crypto and NFT trading full-time. He has a strong background in finance, with MBA from a prestigious B-school. He delves deep into these innovative fields, unraveling their intricacies. Uncovering hidden gems, be it coins, tokens or NFTs, is his expertise. NFTs drive deep interest for him, and his creative analysis of NFTs opens up engaging narratives. He strives to bring decentralized digital assets accessible to the masses.


