
 Home
Home News
News
- 1 Google’s stock price surged 4% in the last week.
- 2 Google’s share price (NASDAQ: GOOGL) surged 0.08% in intraday on Tuesday to close at $135.77.
- 3 Alphabet Inc. (GOOGL) price is in an inclining trend taking support from a trendline.
Google’s stock price had been on an inclining trend for the last 6 months attaining a return of 44.36% and gaining more than 5% in the past 1 month. The stock has followed a strong uptrend since it broke above the key moving average of 200 EMA.

The daily chart shows that the stock price has shifted its long-term trend to bullish in April 2023 and never looked back. The price is strongly maintaining itself above the 50 EMA and surging higher to smash the $150 level taking support from the EMA.

Alphabet Inc. (GOOGL) disclosed quarterly earnings on 25 July 2023 which triggered a gap-up opening followed by a consolidation at the upper levels. Recently, the stock has made a breakout of the consolidation and hedging towards the $140 level.
The analyst is offering a 1-year price forecast for Alphabet Inc. has a maximum estimate of $200 and a minimum estimate of $121. Google (NASDAQ: GOOGL) engages in cloud-based solutions that provide enterprise customers with infrastructure and platform services.
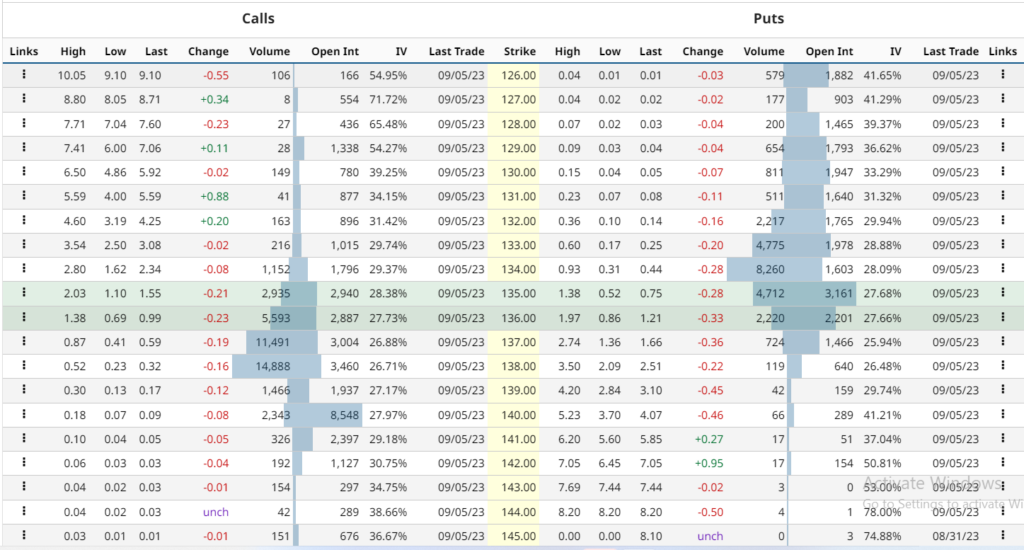
Google stock derivatives data analysis states that the current implied volatility in the market is 24.63% with an increment of 1.79% in the last trading session. The at-the-money strike price has 3,161 open contracts on the PUT side and 2,940 open contracts on the CALL side indicating the dominance of buyers at the current level. The PUT/CALL ratio is 0.82 indicating a neutral sentiment in the market as per the data.
Google Stock Price Shows A Breakout Of Consolidation On The Daily Chart
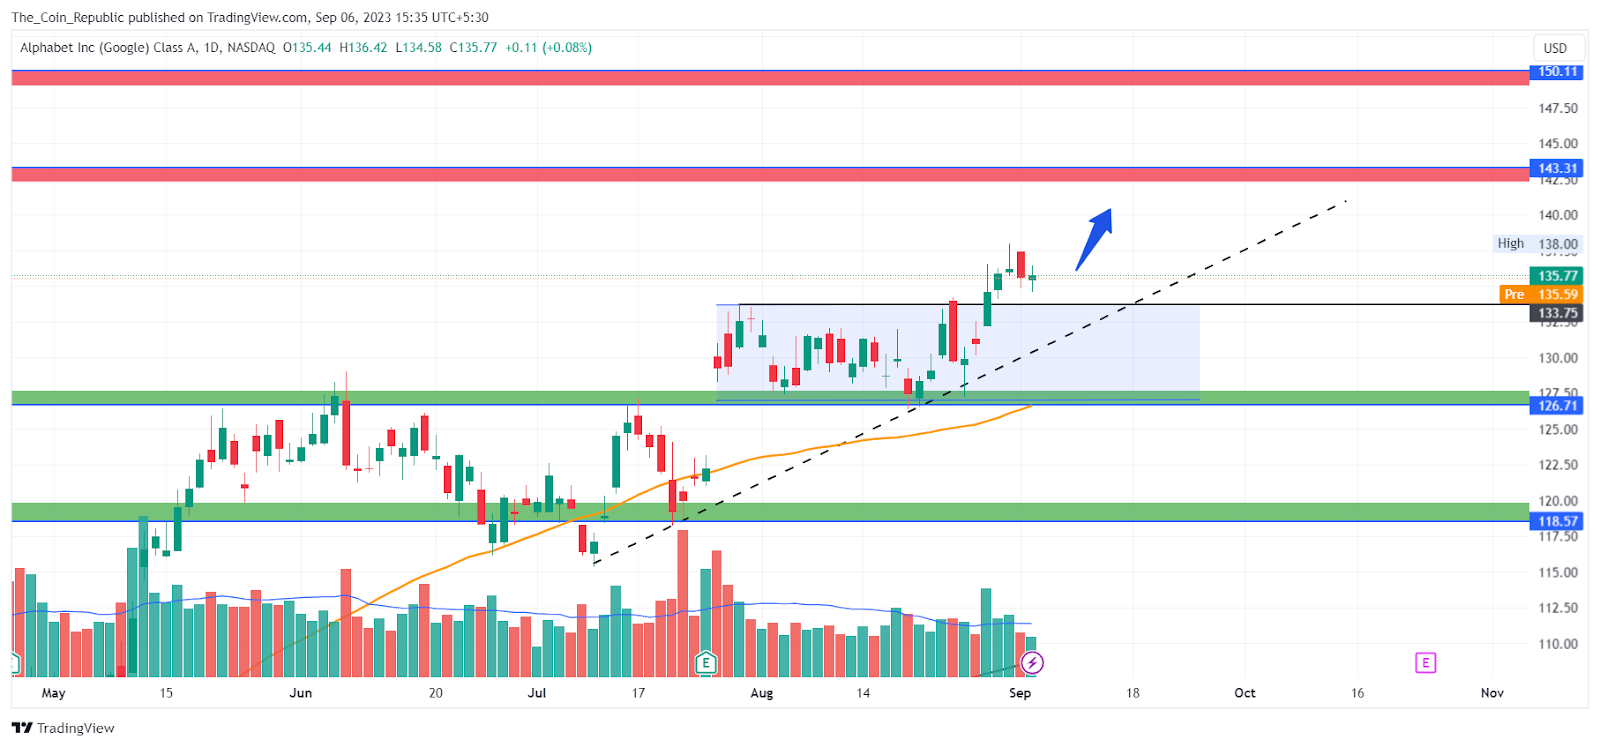
The short-term outlook of the analysts indicates that the stock is showing a strong uptrend maintaining itself above the key moving averages. The price consolidated at the top to settle the volatility caused by the earnings. The stock may resume with the ongoing trend to break above the $140 and $150 levels.
The long-term trend is also bullish until the price maintains above the key moving averages.
Technical Indicators Prediction About the Current Trend

The EMA analysis shows that the GOOGL stock price is trading above the 50 and 200-day EMA indicating a strong trend prevailing in the market.
The technical indicators including RSI and MACD opinion rating for the stock is a 90% buy with an average short-term outlook on maintaining the current trend. The long-term indicators are optimistic and fully support the continuation of the ongoing trend.
Conclusion
Google’s stock price has been rising for the last 6 months and gained 44.36% return. The price is above the 200 EMA and the 50 EMA and broke the $150 level. Google reported quarterly earnings on 25 July 2023 and had a gap-up opening. The price broke out of the consolidation and headed towards the $140 level.
The analysts gave a maximum estimate of $200 and a minimum estimate of $121 for the stock price. Google provides cloud-based solutions for enterprise customers. The stock is bullish in both short-term and long-term.
Technical Levels
- Support levels: $126.71 and $118.57
- Resistance levels: $143.31 and $150.11
Disclaimer
The views and opinions stated by the author, or any people named in this article, are for informational purposes only and do not establish financial, investment, or other advice. Investing in or trading crypto or stock comes with a risk of financial loss.

Andrew is a blockchain developer who developed his interest in cryptocurrencies while pursuing his post-graduation major in blockchain development. He is a keen observer of details and shares his passion for writing, along with coding. His backend knowledge about blockchain helps him give a unique perspective to his writing skills, and a reliable craft at explaining the concepts such as blockchain programming, languages and token minting. He also frequently shares technical details and performance indicators of ICOs and IDOs.


