
 Home
Home News
News
- 1 Optimism crypto price decreased by 11.23% over the past seven days.
- 2 Optimism crypto price is currently trading at $1.327 with a drop of 1.26% in the past 24 hours.
Optimism price prediction indicates that Optimism crypto may see further depreciation in its value within the next few months. Presently, the Optimism price is down by 11.30% over the past 7 days and according to the price action it is facing bearish pressure.
At present, the bears are in charge of the trend where they are maintaining firm command over the price action, although the bulls attempted to take control. Despite the bullish optimism, the buyers were unable to break above 200 EMA, and bears regained supremacy over the price action on the 1-day chart.
Optimism crypto is trading under the key exponential moving averages within the bear’s grasp. The price is facing resistance from the 50 EMA on the daily timeframe. The price is facing substantial selling pressure in the supply zone which indicates that the bears may push its value down further in the near future.
The technical indicators suggest that bears hold the edge over the price action. The price pattern, oscillators, EMA’s, and Volume are moving in tandem, giving similar signals. At the time of writing, OP is trading at $1.328 with an intraday gain of 0.58%, signaling bearishness. Moreover, the trading 24-hour volume is 427.017K and the last 10 days’ average trading volume is $1.599 Million.
Technical Analysis of Optimism Crypto Price in 1-D Timeframe
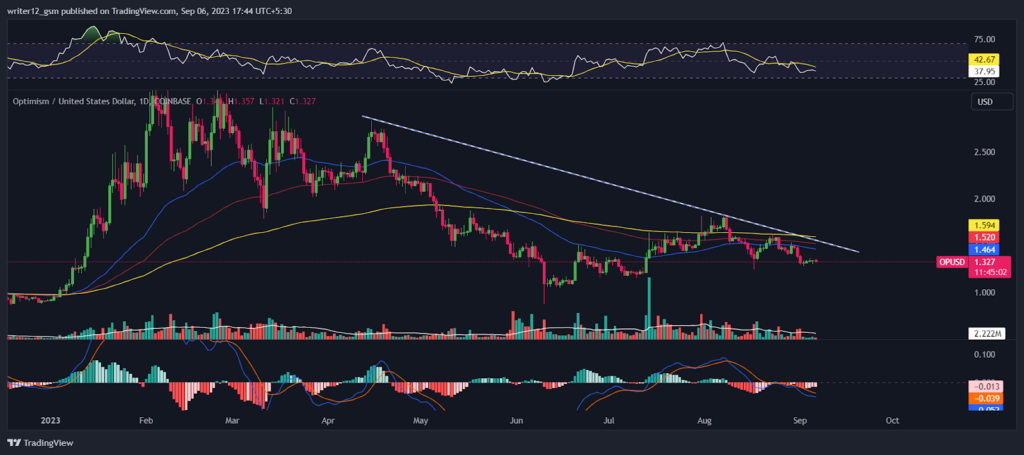
At the time of publishing, Optimism crypto (USD: OP) is trading below the 50 and 200-day SMAs (Simple moving averages), which are supporting the price trend.
If more selling volume adds up, then the price might conquer supporting SMAs by making lower highs and lows. Hence, OP price is expected to move downwards giving bearish views over the daily time frame chart.
The current value of RSI is 38.03 points. The 14 SMA is above the median line at 42.68 points which indicates that the Optimism crypto is bearish. The MACD line at -0.052 and the signal line at -0.039 are below the zero line. A bearish crossover is observed in the MACD indicator which signals more bearishness for the OP crypto price.
Summary
Technical oscillators support the bearish trend. The MACD, RSI, and EMA emphasize the negative signs and imply that the downtrend may continue in the OP crypto price. Optimism price action suggests that the investors and traders are bearish on the 1-D time frame. The price action reflects a bearish perspective at the moment. The current scenario requires traders and investors to be patient and look for a clear break below or above the range before making any moves and avoid the fear of missing out to minimize losses.
Technical Levels
- Support Levels: $1.150 and $0.910.
- Resistance Levels: $1.727 and $2.064.
Disclaimer
The analysis provided in this article is for informational and educational purposes only. Do not rely on this information as financial, investment, or trading advice. Investing and trading in crypto involves risk. Please assess your situation and risk tolerance before making any investment decisions.

Nancy J. Allen is a crypto enthusiast, with a major in macroeconomics and minor in business statistics. She believes that cryptocurrencies inspire people to be their own banks, and step aside from traditional monetary exchange systems. She is also intrigued by blockchain technology and its functioning. She frequently researches, and posts content on the top altcoins, their theoretical working principles and technical price predictions.


