
 Home
Home News
News

- 1 SUI price is in a downtrend and is retracing toward the demand zone.
- 2 Buyers are losing strength and stayed cautious in the past sessions.
SUI price shows consolidation. It hovered in a narrow range below the 20-day EMA in the past few sessions. Moreover, the price action shows seller dominance and persisted in a short buildup, willing to retest the demand zone near $0.4000. However, the price is close to the support zone near $0.4500 and may rebound if it sustains near $0.4700. The chart structure is neutral and does not reflect any massive selloff. But profit booking was witnessed, and the token persisted in correction.
SUI token price shows a negative outlook and may retest the lower neckline soon. Moreover, the buyers did not gain momentum and started to unwind their positions, reflecting a weak chart structure. SUI token is now trading below the significant moving averages and below the mid-Bollinger band, indicating low investor interest. On the other hand, the sellers looked strong and gained traction. As per Fib levels, the SUI token is now slipping below neutrality and is headings toward the 38.2% Fib level, showing weakness on the charts.

At press time, the SUI token price trades at $0.4811 with an intraday gain of 0.32%, showing neutrality on the charts. Moreover, the trading volume increased by 9.91% to $40.32 Million, and the pair of SUI/BTC is at 0.0000186 BTC. However, the market cap of SUI is $256.53 Million. Moreover, analysts maintained a sell rating with a yearly target price of $0.4500, suggesting a negative outlook for the upcoming sessions.
SUI Price Fib Retracement On Daily Charts
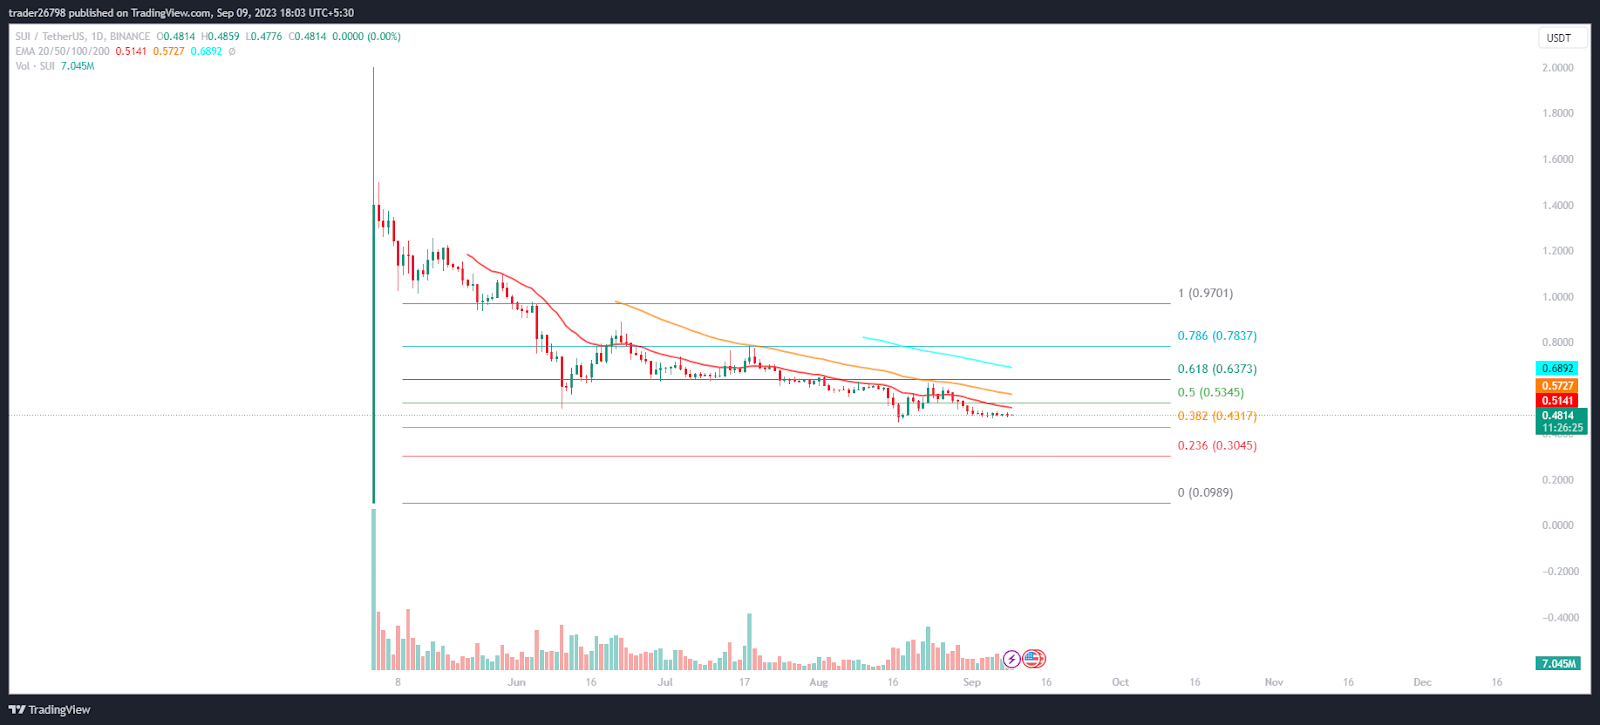
On the daily charts, the SUI price shows a descending triangle pattern and forms a lower lows sequence for the past sessions. However, the price is trying for a pullback and may see a rebound soon as per the technicals. SUI price is close to the value area, and buyers are trying to register a pullback.
Short Term Charts Shows Head And Shoulder Pattern
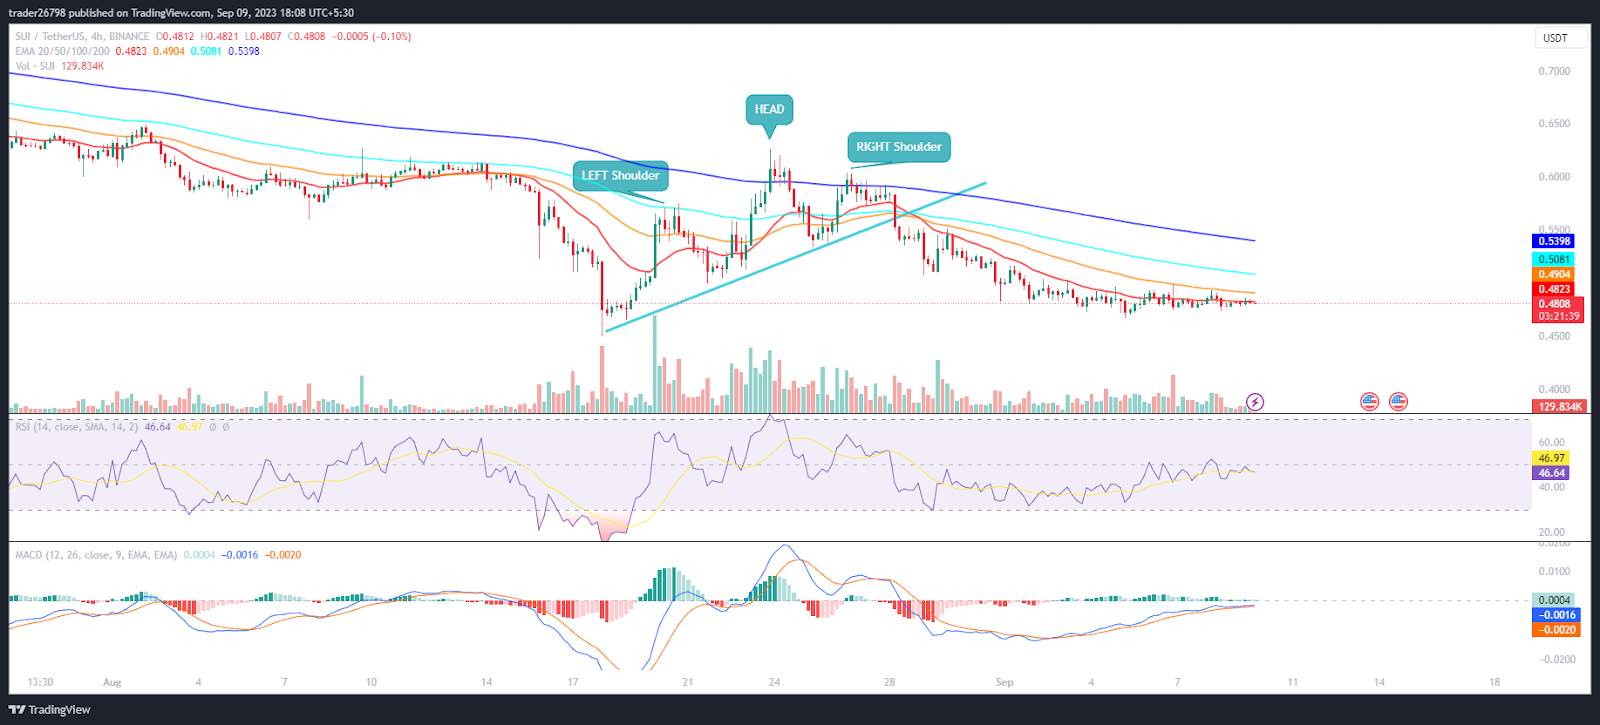
On the 4-hour charts, the SUI token shows a head and shoulder pattern and a breakdown was witnessed in the past sessions. Furthermore, the price is now close to the support region, which, if it breaks, may reflect further selloff toward the lower trajectory of $0.4500 followed by $0.4200.
The RSI curve stayed near neutrality and consolidated near the lower neckline of $0.4800, and suggests a rebound if it sustains and will try to retest the 20-day EMA.
The MACD indicator showed a bullish crossover, formed green bars on the histogram, and suggested a neutral chart structure.
Summary
SUI token price shows a downtrend and faces profit booking for the past sessions. Moreover, the price action reflects the sellers’ short buildup and willingness to break the immediate support region near $0.4700. Furthermore, the price is near neutrality, and a breakdown or bounce can be anticipated soon. SUI token has an immediate support of $0.4500, and the upper trajectory is near $0.5000.
Technical Levels
Support Levels: $0.5000 and $0.5200
Resistance Levels: $0.4500 and $0.4200
Disclaimer
The views and opinions stated by the author or any people named in this article are for informational purposes only, and they do not establish financial, investment, or other advice. Investing in or trading crypto or stock comes with a risk of financial loss.

Andrew is a blockchain developer who developed his interest in cryptocurrencies while pursuing his post-graduation major in blockchain development. He is a keen observer of details and shares his passion for writing, along with coding. His backend knowledge about blockchain helps him give a unique perspective to his writing skills, and a reliable craft at explaining the concepts such as blockchain programming, languages and token minting. He also frequently shares technical details and performance indicators of ICOs and IDOs.


