
 Home
Home News
News
- 1 Carnival stock price is currently trading at $15.30 with a trading volume of 13.704 Million in the last 24 hours and a market cap of $19.119 Billion.
- 2 CCL stock price will probably take a reversal from the 50% Fibonacci level in upcoming sessions.
Carnival stock price prediction suggests a reversal in the stock price as it took support on the 100 EMA line and close to the 50% Fibonacci level. If the CCl stock price took a reversal from the present level, it might smash through key resistance levels in the near future.
However, currently, sellers and buyers are yet to grasp the trend. Investors might prefer to wait for the confluence of multiple technical indicators in order to decide the direction of the trend. There is a slight increase in the green volume bars which indicates the CCL price is manifesting buyers at the demand zone.
CCL stock chart shows that investors are indecisive at the moment. Nevertheless, CCL stock price has declined around 12.37% in a month but gained 18.79% in 3 months. Also, the CCL share price hiked around 62.08% in the last six months. However, the CCL stock gave an excellent return of 85.68% year to date demonstrating a good performance throughout the year and recent weakness.
CCL Stock Defends $15; Getting Ready for $20
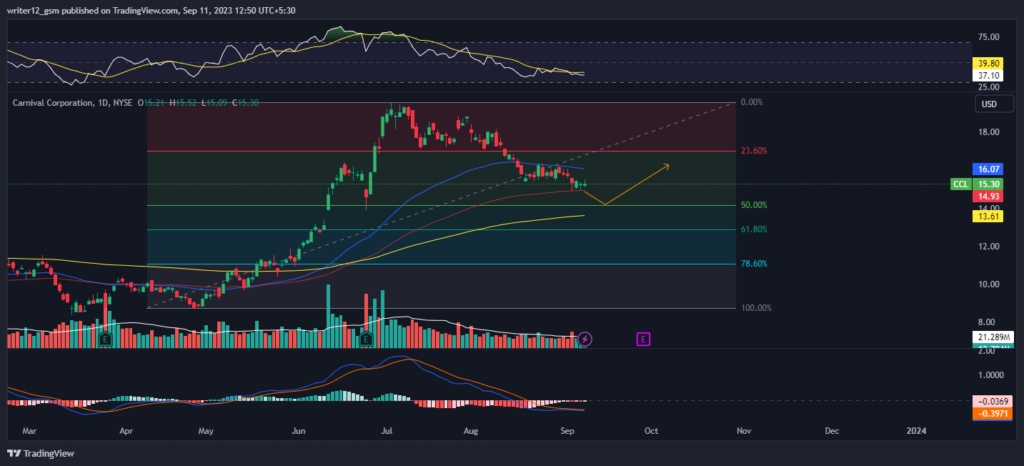
Carnival stock price is trading below the 20 and 50 EMAs but above the 100 and 200 EMAs. Moreover, Carnival shares must register its breakout above the 50 EMA over the daily time frame chart. Carnival stock price lost 3.35% in a week and 12.37% in a month during the correction phase, but it might take a reversal from the current level.
Technical indicators are signaling neutrality. The relative strength index (RSI) showcases the sideways momentum of Carnival shares. RSI was at 54 and is heading towards the oversold territory.
MACD exhibits the downward phase of the Carnival share price. The MACD line is trading below the signal line. Investors in Carnival stock need to wait for any directional change over the daily time frame chart.
CCL Looking Strong On Weekly Time Frame
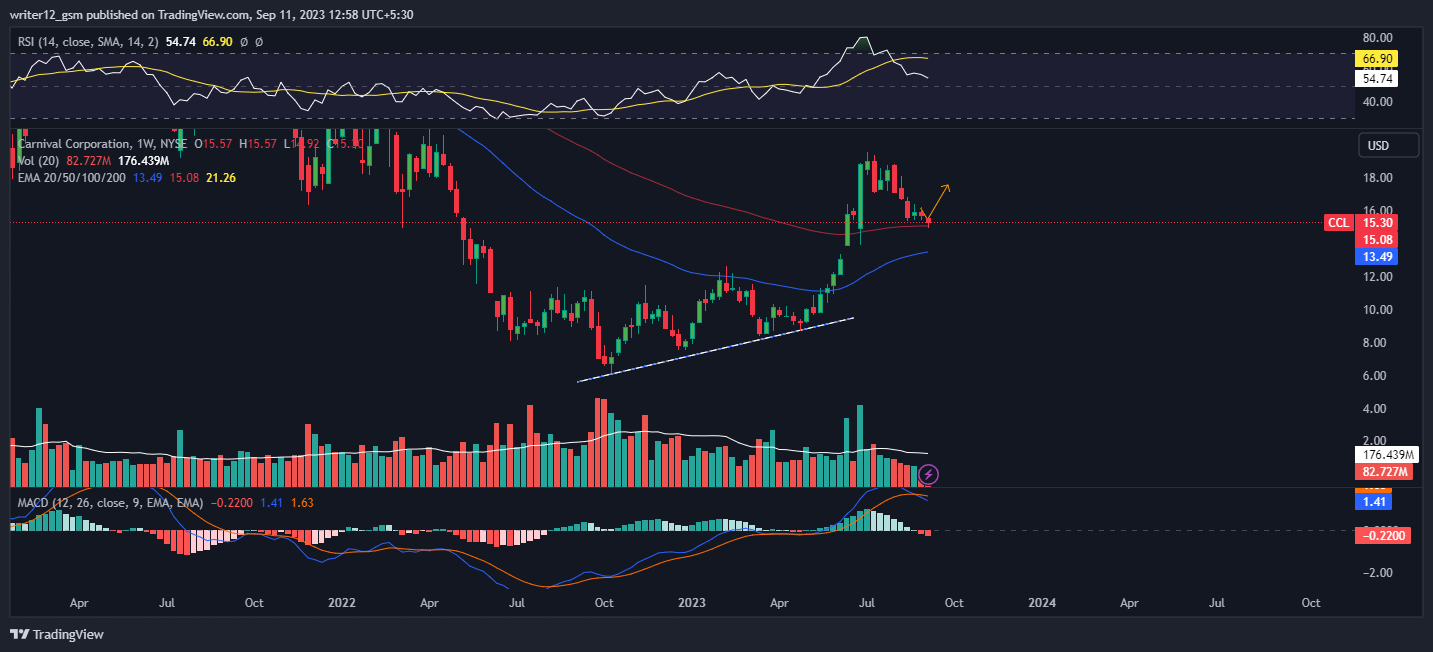
On a weekly timeframe, the CCL share price takes support on 100 EMA and probably it will approach 200 EMA in the next few sessions. Meanwhile, Carnival stock The RSI is floating above the median line at 54 points and the MACD is also in a positive zone. A bearish crossover is seen in the MACD which indicates mild bearishness in the stock price. However, in the long term the price action looks bullish.
Summary
Carnival stock price is taking support on 100 EMA and is ready to take a reversal from the current level. The RSI and MACD are trading sideways indicating neutrality. However, analysts are bullish on the stock by giving it a buy rating and gave a price target of $25 for one year.
Technical Levels
- Support Levels: $14.67 and $13.52.
- Resistance Levels: $16.54 and $17.69.
Disclaimer
The analysis provided in this article is for informational and educational purposes only. Do not rely on this information as financial, investment, or trading advice. Investing and trading in stock involves risk. Please assess

Nancy J. Allen is a crypto enthusiast, with a major in macroeconomics and minor in business statistics. She believes that cryptocurrencies inspire people to be their own banks, and step aside from traditional monetary exchange systems. She is also intrigued by blockchain technology and its functioning. She frequently researches, and posts content on the top altcoins, their theoretical working principles and technical price predictions.


