
 Home
Home News
News
- 1 NEAR crypto price is currently trading at $1.11313085 with a 3.30% drop in the last 24 hours with a market cap of $1.049 Billion.
- 2 NEAR crypto price decreased by 1.02% over the past seven days.
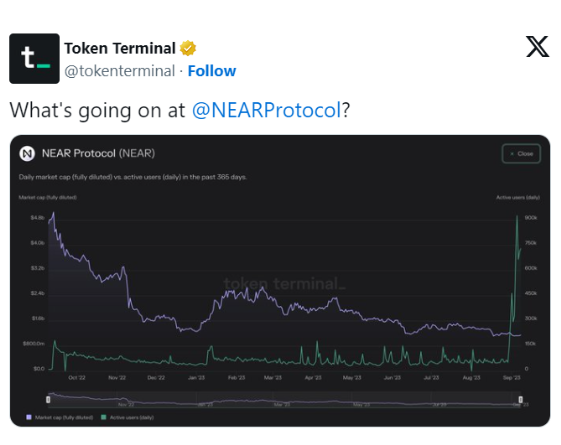
Near Protocol has seen a surge in user activity and network fees since January. The Layer 1 (L1) blockchain network has witnessed a huge increase in the daily count of users, reaching a peak of 926,943 on September 5th. This is a 2500% jump from the 36,211 users recorded on January 1st. The growing demand for the network’s native token NEAR Protocol has also driven up the network fees and revenue.
The price action of the NEAR crypto showed that selling pressure was noted on the charts and was in a downtrend, forming lower lows over the past few months. Moreover, due to declining investor interest, trading volume was below average.

The ongoing trend favors bears. The crypto was also in a corrective phase, which made buyers cautious. Moreover, the NEAR Protocol trades below key moving averages and could attain the 50-day EMA to hold the gains.
Technical Analysis of NEAR Protocol Price in 1-D Timeframe
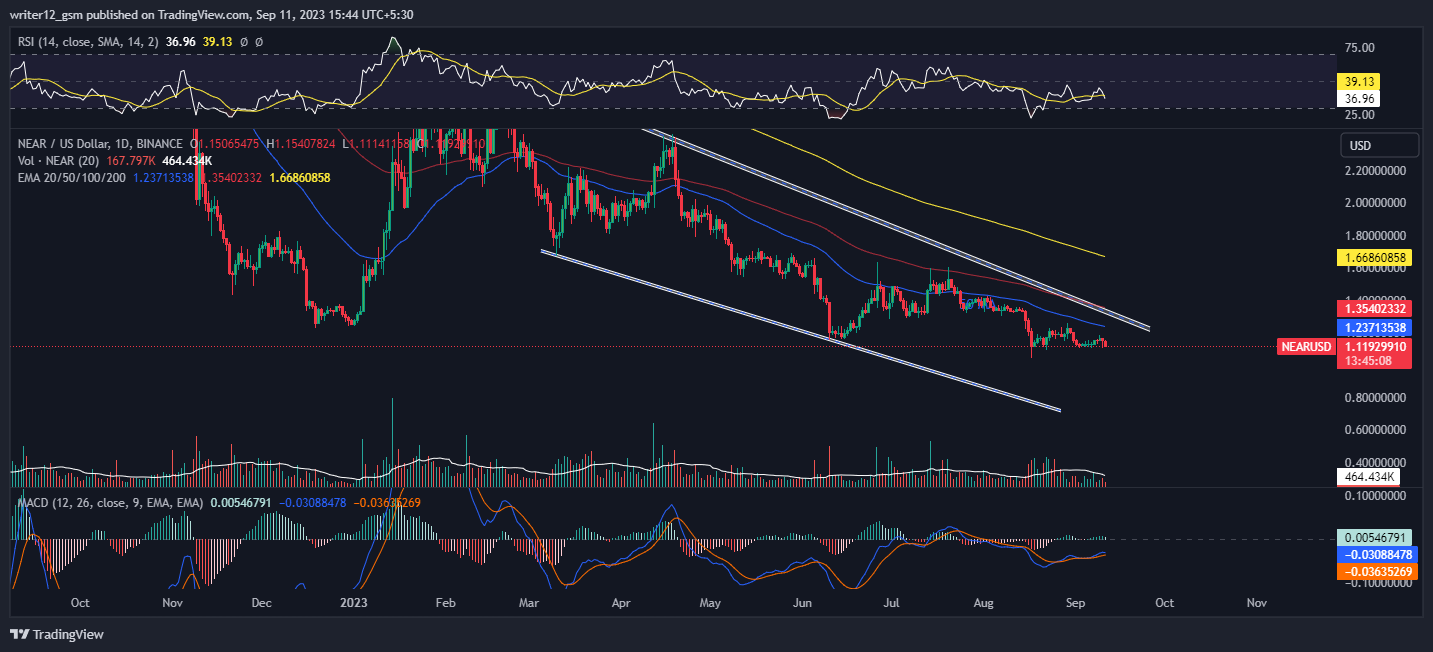
At the time of writing, the NEAR Protocol price is trading at $1.11313085 with an intraday loss of 3.30%, showing a bounce from the lower trendline near the support mark of 50 EMA.
NEAR Crypto has had a poor performance over the years. Year-to-date it gave negative returns of 10.17% and gave 46.91% in the span of 6 months. In the last 1 month, it gave a negative return of 15.38% and gave a positive return of 0.21% in the last seven days, indicating a long Bearish trend.
NEAR price is trading below the downward-sloping 50-day and 200-day EMAs showcasing a downtrend. However, the Near protocol has gone far away from the EMAs.
The MACD generated a negative crossover and the histogram is also red indicating bearishness. The current value of RSI is 35 points. The 14 SMA is above the median line at 37 points which indicates that the NEAR Protocol is bearish.
On the 4-hour charts, the NEAR price is stuck in a narrow range and does not signal an upcoming rise because of low volume levels. Moreover, a key indicator is still in the neutral range and does not signal bullishness. The RSI curve is near 42, in the neutral range, and showed a narrow consolidation move on the short-term charts.
The MACD indicator still showed green bars on the histogram with a bullish crossover but did not signal any substantial upswing.
Summary
NEAR price technical oscillators also support the bearish trend. The MACD, RSI, and EMA are emphasizing negative signs and imply that the downtrend may continue in the NEAR crypto price. NEAR Price action suggests that the investors and traders are bearish on the 1-D time frame. The price action reflects a bearish perspective at the moment.
Technical Levels
- Support Levels: S1 $0.98920328, and S2 $0.82373216.
- Resistance Levels: R1 $1.20622614, and R2 $1.37169726.
Disclaimer
This article is for informational purposes only and does not provide any financial, investment, or other advice. The author or any people mentioned in this article are not responsible for any financial loss that may occur from investing in or trading. Please do your own research before making any financial decisions
Steve Anderson is an Australian crypto enthusiast. He is a specialist in management and trading for over 5 years. Steve has worked as a crypto trader, he loves learning about decentralisation, understanding the true potential of the blockchain.


