
 Home
Home News
News

- 1 BTC price observed a consolidation and hovering in a narrow congestion zone in the past sessions.
- 2 Buyers have held onto the cluster of $25K decisively and are attempting to bounce.
Bitcoin (BTC) price made a bullish engulfing candlestick near $25k, signaling that buyers are now trying to jump above the 20-day EMA and looking for a reversal. Furthermore, a double bottom pattern was formed on the daily charts, having its neckline near $26,500, which, if it breaks, would lead to a short-term rally toward $27K. On the other hand, BTC has hovered in a narrow congestion zone in the past sessions and shown a slower pace and lack of investor interest. Furthermore, the open interest of strike $25K was a strong support zone and a challenge for bears to break, whereas $27K was an immediate hurdle to surpass the bulls.

Bitcoin (BTC) is in a dilemma right now and waiting for a decisive breakout to establish a solid momentum to surpass the markable clusters shown on the charts. BTC price faced a correction and is now hovering near $25K, it could escape the trendline and 20-day EMA to reach $27K.

At press time, Bitcoin price is trading at $25849.03 with an intraday gain of 0.60%, showing a neutral chart structure. Moreover, the trading volume increased by 3.65% to $16.83 Billion. Moreover, the market cap of Bitcoin is $504.89 Billion. However, analysts maintained a neutral rating and suggested volatility for the following sessions. Moreover, sellers attempted to break the immediate cluster of $25K to drag BTC toward the swings of $23K, followed by $20K for the upcoming sessions.
What Levels BTC Reach First $30K Or $20K?
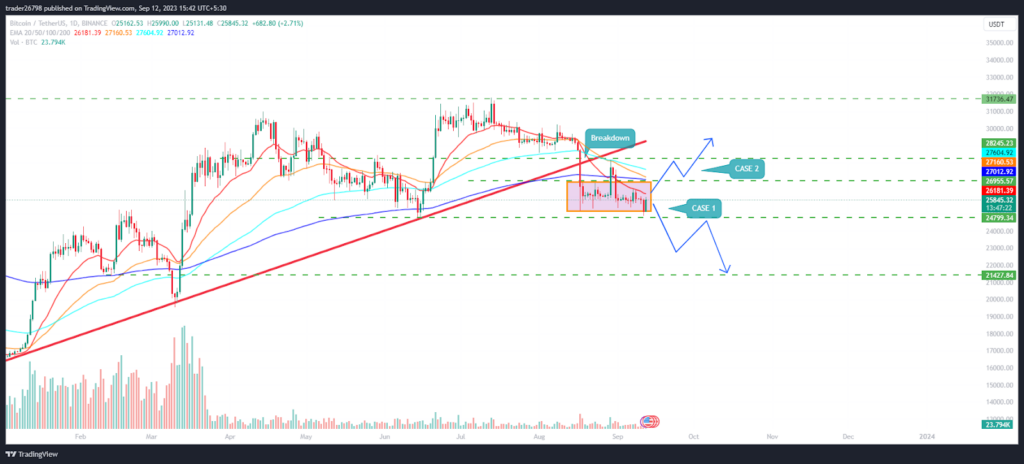
On the daily charts, BTC price is trading inside the narrow range and showing a bullish engulfing candlestick, signaling a rebound from the lower trajectory to hold the cluster of $25K. Moreover, the technicals suggest that $25K is the ideal support zone where bulls maintained a strong grip over there and are attempting a pullback to retest the 200-day EMA near $27K. Conversely, sellers have started covering their short positions, which might be a reason for a bounce.
Short term Charts Signals Buying Opportunity for BTC to Reach $27K
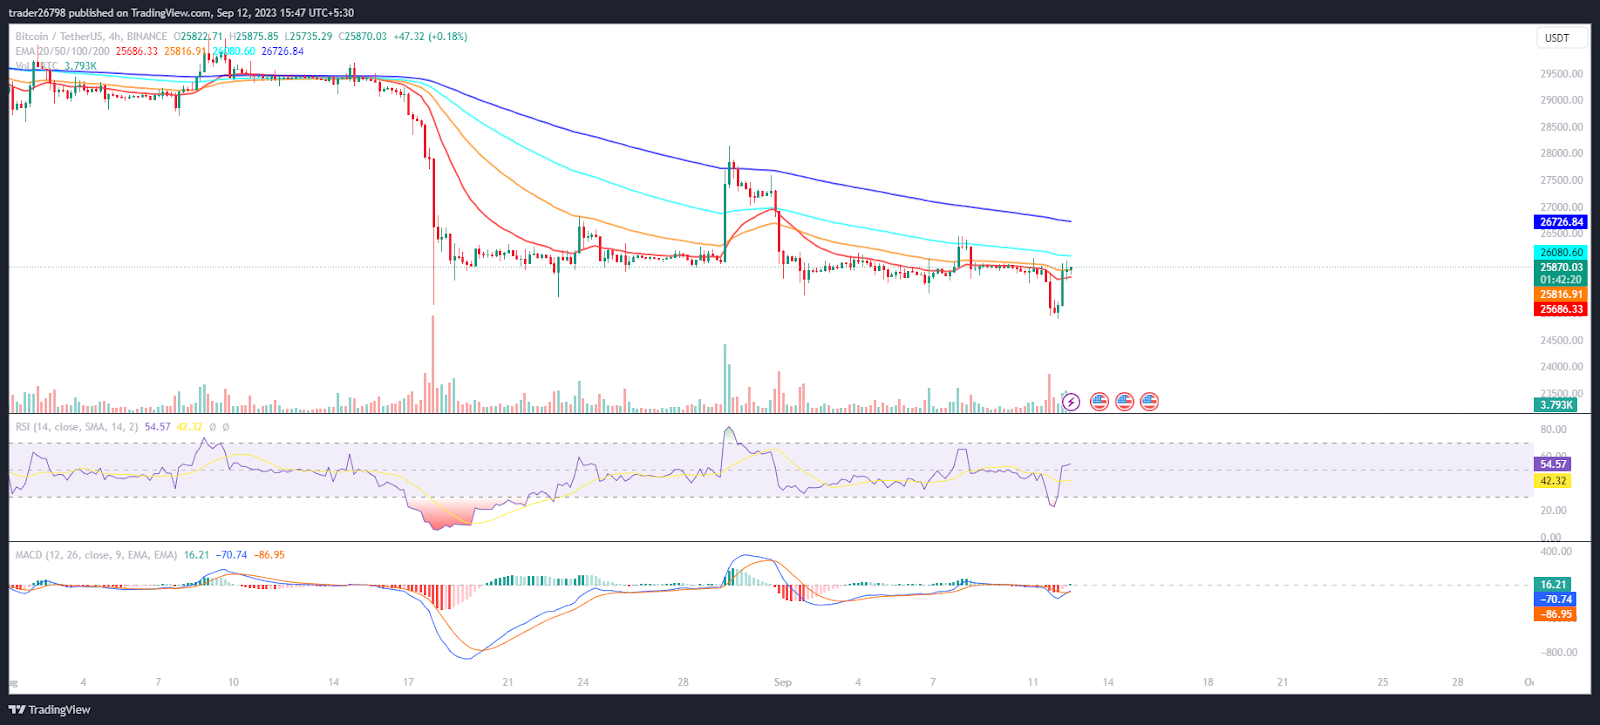
On the short-term charts, BTC initiated a buy signal and showed signs of reversal from the neckline of $25K. Moreover, the technicals showed long build-ups, and investors now show buying interest in the last trading sessions.
The RSI curve bounced from the oversold region, showing a positive crossover and a short-term bounce toward $27K.
The MACD indicator showed a bullish crossover and suggested buying traction and a rise in momentum, leading to a bounce for the upcoming sessions.
Summary
Bitcoin (BTC) price shows strong buying interest and a solid bullish engulfing candlestick shows investors’ interest and long build-up activity in the last trading session. Moreover, the price action signaled a buy call and suggested follow-up buying action, which led BTC to retest the 200-day EMA mark near $27K for the following sessions.
Technical Levels
Support Levels: $25K and $23K
Resistance Levels: $27K and $29K
Disclaimer
The views and opinions stated by the author or any people named in this article are for informational purposes only, and they do not establish financial, investment, or other advice. Investing in or trading crypto or stock comes with a risk of financial loss.

With a background in journalism, Ritika Sharma has worked with many reputed media firms focusing on general news such as politics and crime. She joined The Coin Republic as a reporter for crypto, and found a great passion for cryptocurrency, Web3, NFTs and other digital assets. She spends a lot of time researching and delving deeper into these concepts around the clock, and is a strong advocate for women in STEM.


