
 Home
Home News
News
- 1 The Bitcoin crypto’s price faces resistance and gave a breakdown from the vital trendline, which decreased by 13.60% over the last month and 0.78% over the last week.
- 2 The price of the BTC crypto is trading at $25824 and the 52-week range is $15479 – $31818.
Bitcoin (BTC) is a digital currency that enables online transactions between users without any middlemen. It was launched in 2009 by a mysterious person or group using the pseudonym Satoshi Nakamoto. It relies on a distributed ledger called blockchain to store and validate every transaction. Bitcoin is a predominantly used and prizable cryptocurrency in the world.
According to the news providing website, The Economic Times, Grayscale Investments wants the U.S. SEC to approve its spot bitcoin ETF, which would follow bitcoin’s price directly. The SEC had denied its request without a good reason, but a court of appeals sided with Grayscale and told the SEC to reconsider.
The maximum market cap of Bitcoin (BTC), if all 21 Million BTC tokens were available today, is $551,328,351,000. This is the fully diluted valuation (FDV) of the cryptocurrency. However, not all BTC tokens are in circulation yet, as they are released slowly over time. This means that the actual market cap of Bitcoin (BTC) may be lower than the FDV. According to CoinGecko, it may take several years for the FDV to be achieved.
Bitcoin crypto surged 1.79% in market value and by 0.37% in trading volume in the last 24 hours, per Coinmarketcap which is a crypto data and info website. Its market value is $510,980,136,301 and its trading volume is $12,270,765,902. There are 19,479,418 BTC in circulation.
Bitcoin (BTC) open interest is $11.54 Billion, as per Coinglass, which is a crypto analysis website, it rose by 4.03% in the previous session. The long versus short ratio for 24 hours is 1.0572. The total number of short positions added in the last 24 hours is $24,917,639.288 against longs of $7,425,170.18.
Moreover, BTC coin has not shown good performance this month, as it fell by 11.89% but surged by 27.27% in the past six months. Also, the year-to-date return of BTC price is positive with a 58.61% incline.
Technical Analysis Of BTC Crypto in the 1-Day Timeframe
BTC has been on a rising trend since November last year, even before 2023 began. The BTC price found a strong support around $15479 and was bought heavily as it was a bargain at that time. The price climbed steadily without breaking the trendline from $15479 to $31818, reaching the yearly high by July 13th, 2023. The price also followed the Fibonacci levels of 61.80%, 50.00%, 38.20%, and 23.60% and respected them effectively as seen on the charts, and bounced back from these Fibo levels.
However, the BTC turned bearish by July 14th and broke the most important trendline that it was following faithfully on August 17th, 2023. The current market price is at the Fibo 38.20% level trying to hold but if it fails then it will fall below the previous low and the market character will change and turn the overall trend bearish.
Therefore, to continue its uptrend the price must treat this as a pullback and then it might rise up to or beyond resistance levels of $26777 and $27936.
However, if the price falls below the previous low then the change of character might lead to a downfall and the supports will be $24976 and $23732.
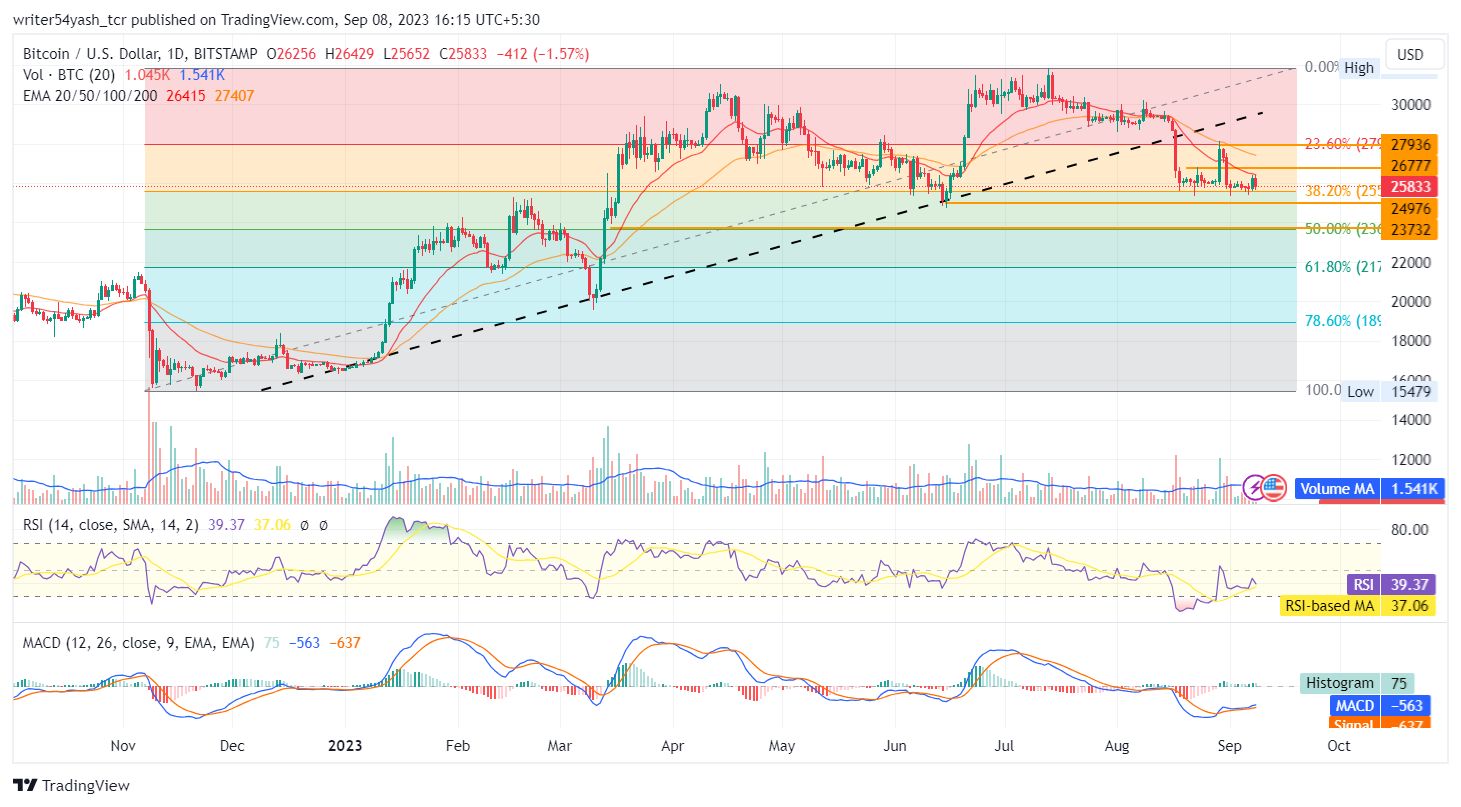
At the time of publishing, Bitcoin (BITSTAMP: BTC) is trading below 20 and 50-day EMA, showing bearishness on daily charts. RSI is around 39, turned bearish and MACD indicates bearishness to consolidation. Collectively, the indicators view is consolidation to bearishness.
Conclusion
BTC crypto price prediction indicates bearish sentiments and perspectives of investors and traders regarding the crypto in the daily time frame. Bitcoin price action highlights a consolidation to a negative outlook at the time of publishing. Moreover, the most sought and reliable technical oscillators like RSI, EMA, and MACD suggest the continuation of the consolidation to bearishness over the daily time frame chart regarding the price.
Technical Levels:
- Support levels: The nearest support levels are $24976 and $23732.
- Resistance levels: The nearest resistance levels are $26777 and $27936.
Disclaimer
In this article, the views and opinions stated by the author, or any people named are for informational purposes only, and they don’t establish the investment, financial, or any other advice. Trading or investing in cryptocurrency assets comes with a risk of financial loss.

With a background in journalism, Ritika Sharma has worked with many reputed media firms focusing on general news such as politics and crime. She joined The Coin Republic as a reporter for crypto, and found a great passion for cryptocurrency, Web3, NFTs and other digital assets. She spends a lot of time researching and delving deeper into these concepts around the clock, and is a strong advocate for women in STEM.


