
 Home
Home News
News
- 1 Flare crypto price decreased by 2.56% over the past seven days.
- 2 Flare crypto price is currently trading at $0.01171 with a current market cap of $269.04 Million.
- 3 FlareUSD is under bearish pressure.
The Flare price prediction shows that the crypto is trying to break the 50 EMA on the daily time frame chart. Flare crypto needs positive momentum in order to break out from the descending pattern. However, sellers may approach 50-SMA which is acting as a resistance to the crypto price. However, the 24-hour trading volume (2.866 Million) is lower than the 10-day average volume of 2.002 Million.
Flare price prediction shows that investor sentiments regarding the Flare token are bearish. Investors may prefer to keep a keen watch over the crypto. Presently, the Flare price is below all the key EMA and MA levels.

The Flare Crypto price prediction suggests the token produced an interesting declining pattern. Crypto struggles to move above 20, 50, 100, and 200-day daily moving averages.
The present value of Flare is $0.01171. It has a market capitalization of around $269.043 Million with a fully diluted market cap of $1.178 Billion. The crypto has a circulating supply of 22.975 Million.
FLRUSD has performed poorly so far this year. Year-over-year returns are -70.72% while returns over the past 6 months are -54.42%. The return was -21.83% last month; and -2.35% last week. Technicals signal selling pressure and the technical oscillators indicate bearishness. The moving averages are also on the strong sell side.
Technical Analysis of Flare Crypto Price in 1-D Timeframe
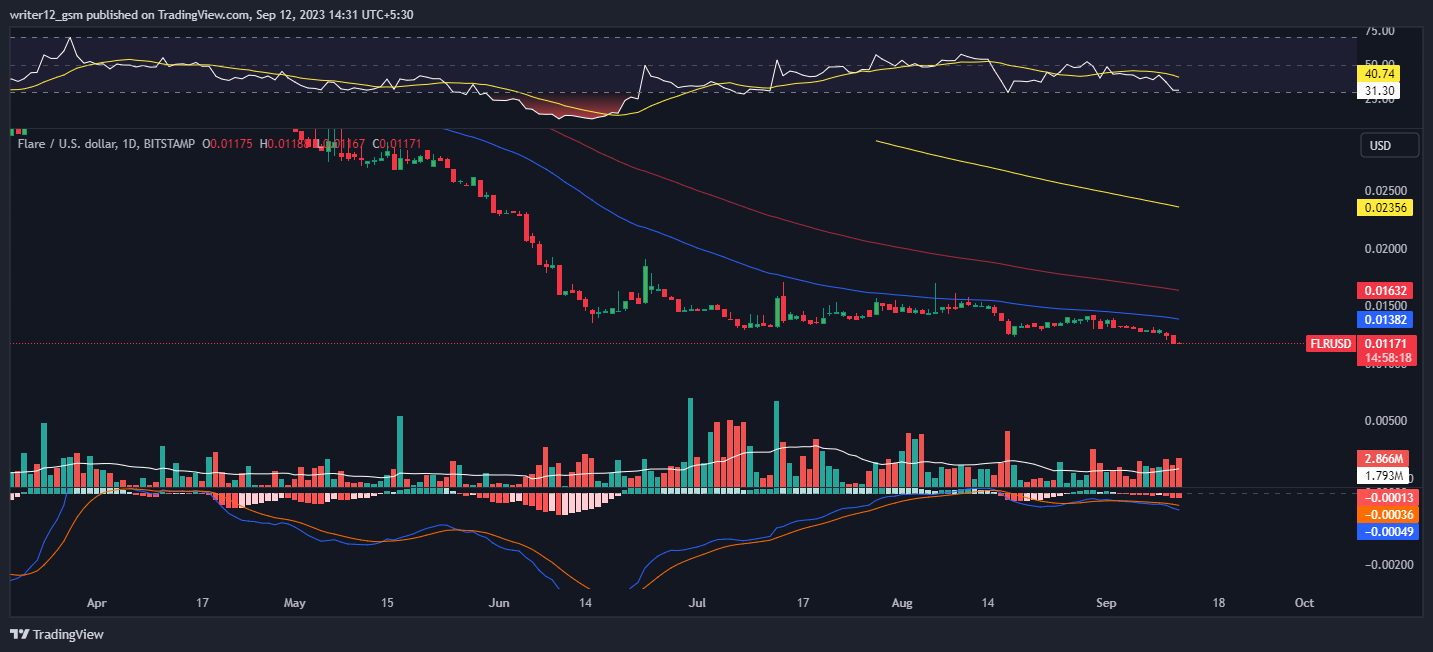
At the time of publishing, Flare crypto (USD: FLR) is trading below the 50 and 200-day simple moving averages, which shows bearish momentum.
However, if selling volume adds up, then the price might conquer supporting SMAs by making lower highs and lows. Hence, the Flare price is expected to move downwards giving bearish views over the daily time frame chart.
The current value of RSI is 31 points. The 14 SMA is below the median line at 40 points which indicates that the Flare crypto is bearish.
The MACD line at -0.00049 and the signal line at -0.00036 are above the zero line. A bearish crossover is observed in the MACD which signals more bearishness for the Flare crypto price.
Summary
Flare (USD: Flare) technical oscillators also support the bearish trend. The MACD, RSI, and EMA are emphasizing negative signs and imply that the downtrend may continue in the Flare crypto price. Flare price action suggests that the investors and traders are bearish on the 1-D time frame. The price action reflects a bearish perspective at the moment.
Technical Levels
- Support Levels: S1 0.01120, and S2 0.00934.
- Resistance Levels: R1 0.01409, and R2 0.01595.
Disclaimer
This article is for informational purposes only and does not provide any financial, investment, or other advice. The author or any people mentioned in this article are not responsible for any financial loss that may occur from investing in or trading. Please do your own research before making any financial decisions
Steve Anderson is an Australian crypto enthusiast. He is a specialist in management and trading for over 5 years. Steve has worked as a crypto trader, he loves learning about decentralisation, understanding the true potential of the blockchain.


