


The price prediction of Immutable over the daily chart illustrates that the crypto price is declining steadily and reaching a two-year low. The bears are in dominance and the price has already made a breakdown of the previous swing low and sliding down.
The daily chart shows that the price has declined forming lower lows and lower highs. The volume analysis shows that the IMX crypto has received a total of $13.01 Million volume in the past 24 hours which is less than the average volume. IMX has a 2.27 as volume to market cap ratio indicating low volatility in the market.
Also, the IMX price slid below the key moving average of 50 and 200-day EMA indicating weakness in the long-term as well as short-term. The bulls made several attempts to break above the previous swing high and shift the trend. However, they failed to make a change in the trend and the price declined again.
Immutable Price Declined Suffering Rejection
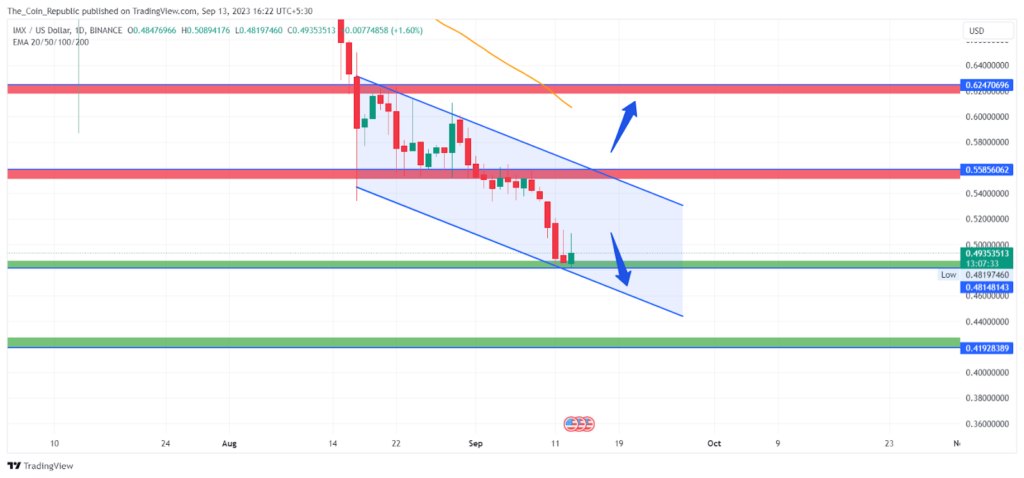
The Immutable price is currently trading at $0.49 and trying to sustain near the demand zone. The breakdown of this might drag the price to the lower support levels. The buyers are unable to counter the bearish trend. The IMX crypto needs more buying volume to counter the selling pressure and surge the price to upper levels.
Technical Indicators Show Weakness Over the Charts

MACD lines are showing a bearish crossover. Histogram bars are also being formed below the mean line but of negligible height indicating the sellers are still in dominant in the game.
The EMA analysis shows that the IMX price dropped below the 50 and 200-day EMA indicating the dominance of bears in the IMX crypto price.
At the time of publishing, the RSI value of the IMX token is 24.27 and that of the SMA line is 29.98. RSI is trading in an oversold region indicating weakness in the price.
Conclusion
The Immutable price is falling and reaching a two-year low. The daily chart shows lower lows lower highs, and low volume. The price is below the 50 and 200-day EMA, showing weakness in both short-term and long-term. The bulls failed to break above the previous swing high and change the trend. The price is at $0.49, near the demand zone. If it breaks down, it may go lower. The buyers need more volume to push the price up.
Technical Levels
- Support levels: $0.49 and $0.41
- Resistance levels: $0.55 and $0.62





