
 Home
Home News
News

- 1 T stock price struggles to defend the $14.00 support.
- 2 AT&T stock price trying to climb above the 50-day EMA to reverse the trend.
- 3 T stock price is stuck in the narrow range consolidation.
AT&T Inc. T stock price was down by 22.84% on a YTD basis and eroded a big portion of its market capitalization. It slipped down by forming lower low swings which raised concern for its long-term investors.

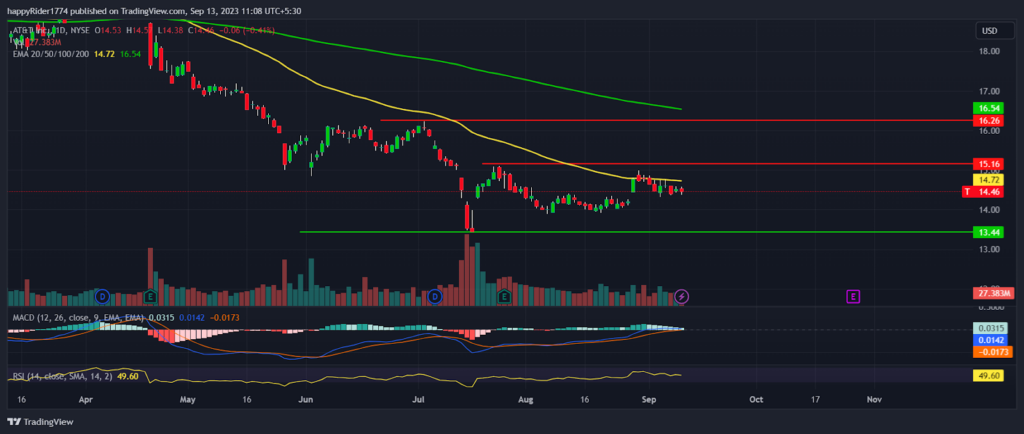
AT&T stock is trading below the downward-sloping 200-day EMA indicating that the positional trend is downwards.
However, recently the T stock price showed a minor bounce and tried to climb above the 50-day EMA. If buyers succeed then short trend reversal may be possible.
At the beginning of July, T stock price tried to break the $16 hurdle to bring back the confidence of investors. But it formed a Doji candle and faced rejection from the supply zone. Later, prices began to decline and eroded the previous gains.
Presently, AT&T share price seems to be stuck in a narrow range between $13.50 to $15.00. It seems to be consolidating for the base formation.
The broader market indices are recovering so it will improve the market sentiment which may positively impact the prices of stocks.
AT&T stock price closed the previous session at $14.46 with an intraday decline of -0.41%. The market capitalization stands at $103.37 Billion.
Will T Stock Price Reverse Upward by 2023 End?
AT&T Inc. T stock price is in a correction phase and forming a bearish pattern. In mid-July, sellers once tried to break down the $14.00 level. Luckily the price bounced back with a high buying volume.
It shows that buyers are active near support and it will be difficult for bears to pull the prices further down. If the buyers are able to break the $15.00 hurdle, then the possibility of continuation of recovery will increase.
On the other hand, if the AT&T stock price faces rejection from $15.00, then it may spend some more time in consolidation.
AT&T Stock Forming a Doji Candle; Signs of Trend Reversal?
AT&T stock price forms a Doji candle on a weekly time frame. The downfall seems to have taken a halt but no strong signs of recovery are visible. Fresh buyers will become active when the price will be able to break the $15.00 level.
However, the AT&T shares had formed a base near $14.00 so the downside risk is also low. The MACD curve is on a slow and steady rise. It indicates mild bullishness. The RSI 49 denotes neutral territory and a balance between bullish and bearish positions.
Conclusion
AT&T Inc. T stock price is stuck in a narrow range and seems to be consolidating for base formation.
The technical analysis suggests that the downfall in AT&T stock has halted. So, if buyers succeed in breaking the $15.00 hurdle, then a bullish trend reversal is possible.
Technical Levels
- Resistance levels: $15.16 and $16.26
- Support levels: $14.00 and $13.44
Disclaimer
The views and opinions stated by the author, or any people named in this article, are for informational purposes only. They do not establish financial, investment, or other advice. Investing in or trading crypto assets comes with a risk of financial loss.

Adarsh Singh is a true connoisseur of Defi and Blockchain technologies, who left his job at a “Big 4” multinational finance firm to pursue crypto and NFT trading full-time. He has a strong background in finance, with MBA from a prestigious B-school. He delves deep into these innovative fields, unraveling their intricacies. Uncovering hidden gems, be it coins, tokens or NFTs, is his expertise. NFTs drive deep interest for him, and his creative analysis of NFTs opens up engaging narratives. He strives to bring decentralized digital assets accessible to the masses.


