
 Home
Home News
News

- 1 AMZN stock price increased by 6.26% over the past week and the current volume is above the 10-day average volume.
- 2 Amazon.com Inc. (NASDAQ: AMZN) stock’s 52-week price range is around $81 – $144.
AMZN stock has been rising since December 2022, before the beginning of 2023, and has shown buyer accumulation and buyers were piling up. Based on recent data, the revenue of the period ending June 2023 was $134.38 Billion with a net income of $6.75 Billion.

AMZN stock price was at $144.85 with an intraday increase of 2.56%. Moreover, the intraday trading volume of AMZN is 60.438 Million higher than the 10-day aggregate volume of 44.066 Million.

The AMZN stock estimated EPS for the period ending June 2023 was 0.354, and the reported EPS was 0.65 which gave a positive surprise of 83.66%. Moreover, the forecasted EPS for the next quarter is positive at 0.578.
As per the news on the Barchart website, an associated press member Haleluya Hadero shared information on September 13th about the increase in pay for the contracted delivery drivers, The market responded positively and a sudden surge was noticed in the AMZN stock.
As per the news, Amazon is raising the pay of its contracted drivers who deliver packages to customers. The company expects U.S. drivers to earn an average of $20.50 per hour, up from the current minimum of $20. The move comes as the Teamsters union is pressuring Amazon to negotiate with its delivery workers. Amazon also announced a $400 Million investment in child care, education, safety, and training of its employees.
Technical Analysis of AMZN Stock Price in 1-D Timeframe
The price action shows that Amazon Platforms Inc. (NASDAQ: AMZN) stock price took its major support from $81 with a swift uptrend and gave a streak of break of structures by making higher highs and lows.
According to the price action, it seems that the AMZN stock is ready for a significant increase with potential growth in price for the upcoming sessions. The stock’s upward direction is supported by the AMZN buyers who are trying hard to maintain these levels.
The AMZN stock is still showing a strong upward trend above the key moving averages. The trend had some signs of slowing down in the share price but soon recovered from the 23.60% fibo level. On the daily charts, AMZN stock is in the bullish zone and has kept the uptrend above the 20 and 50-day EMAs.
Furthermore, the previous swing high was surpassed on September 11, 2023, and rising. The price also followed the Fibonacci levels of 61.80%, 50.00%, 38.20% and 23.60% closely and respected it throughout the period from these Fibo levels throughout the uptrend.
It is also observed on the chart that the price showed some activity on every earnings date. Moreover, the next earnings are on October 26th, market might rise more up to the next earnings report.
If Amazon fails to maintain the current level, the AMZN price could continue to drag downwards and hit the nearest support levels around $137 and $130.
However, if the stock price sustains the current level and Amazon price increases, then it might reach the nearest resistance levels of $150 and $162.
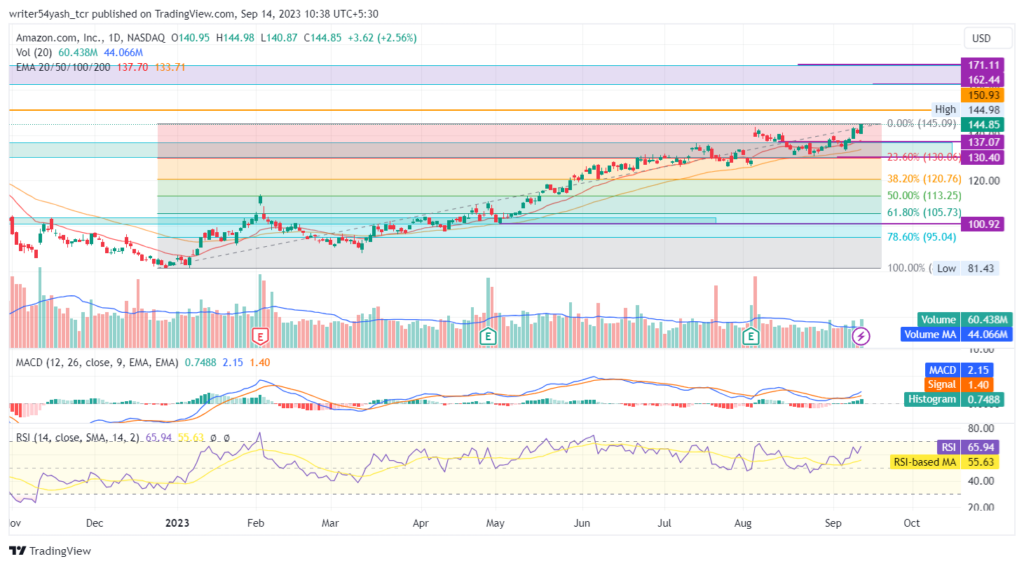
At the time of publishing, Amazon.com Inc. (NASDAQ: AMZN) is trading above the major 20, and 50-day exponential moving averages (EMA), which is supporting the AMZN price trend.
The current value of RSI is 65.94 points. The 14 SMA is below the median line at 55.63 points.
The MACD line at 2.15 and signal line at 1.40 are below the zero line and both lines have narrowed towards each other and gap is broadening and the bullish cross is noticed.
Collectively in AMZN stock, all mentioned indicators highlight positive sentiment.
Summary
Amazon Inc. (NASDAQ: AMZN) indicates that the traders and investors of the stock price are bullish on the 1-D time frame. The price action shows a bullish view at the time of publishing. The technical analysis tools of Amazon stock price also support bullishness. The EMA, RSI, and MACD show upward signals in Amazon stock price.
Technical Levels
- Support levels: $137 and $130
- Resistance levels: $150 and $162
Disclaimer
In this article, the views and opinions stated by the author, or any people named are for informational purposes only, and they don’t establish the investment, financial, or any other advice. Trading or investing in cryptocurrency assets comes with a risk of financial loss.

With a background in journalism, Ritika Sharma has worked with many reputed media firms focusing on general news such as politics and crime. She joined The Coin Republic as a reporter for crypto, and found a great passion for cryptocurrency, Web3, NFTs and other digital assets. She spends a lot of time researching and delving deeper into these concepts around the clock, and is a strong advocate for women in STEM.


