
 Home
Home News
News
- 1 Cardano price prediction showcases the fall of ADA crypto inside an interesting pattern.
- 2 ADA crypto is trading below 20, 50, 100 and 200-day daily moving averages.
- 3 Cardano price managed to gain 1.43% year to date.
Cardano price prediction shows that ADA cryptocurrency has been stuck in a descending triangle pattern on the daily chart since July 2023. While it made an effort to break free from this pattern, it struggled to maintain its upward momentum. With ADA crypto experiencing a prolonged decline, it’s crucial for buyers to step in and reverse this trend.

Cardano price was at $0.2479 and experienced a slight intraday decrease of 0.32% in its market capitalization. Additionally, trading volume dipped by approximately 19.04% during the intraday session. This indicates that ADA cryptocurrency is making efforts to find support along the lower trendline of the descending triangle pattern. The volume-to-market capitalization ratio was at 1.15%.

Analyzing Cardano Price Technical Indications
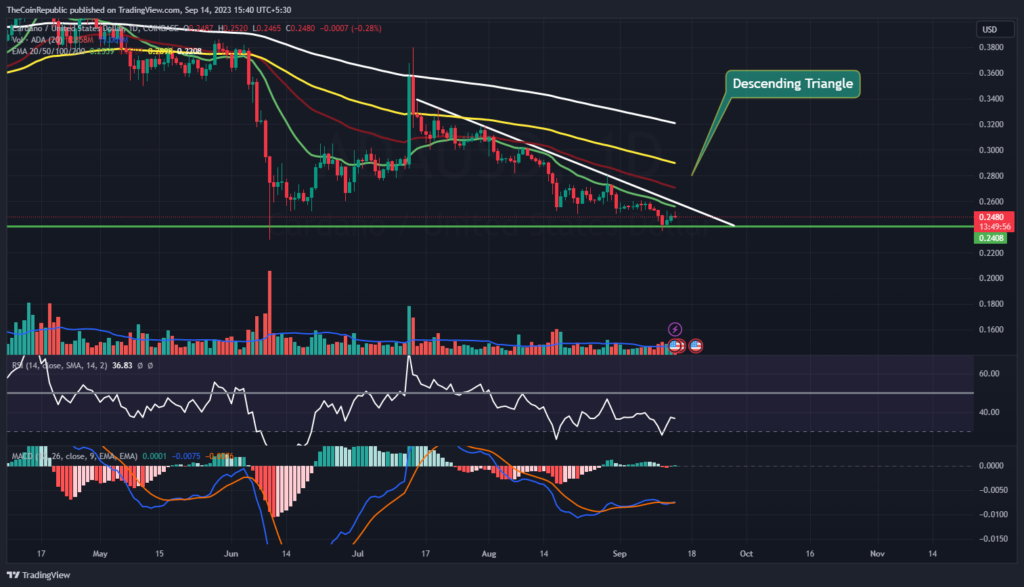
Cardano price prediction is a continued phase of consolidation, specifically within a descending triangle pattern on the daily chart. However, it’s worth noting that the current trading volume is below the typical levels and would benefit from an increase during intraday trading. In a different context, ADA cryptocurrency is currently trading beneath the daily moving averages of 20, 50, 100, and 200 days.
The smaller time frames reveal a noticeable decrease in Cardano price. In the past week, it dipped by around 3.34%, while last month, it experienced a decline of about 14.22%. Examining the three-month window, ADA cryptocurrency has sustained a significant drop of approximately 4.85%. In the last six months ADA crypto slipped around 28.87%. Nevertheless, Cardano cryptocurrency managed to gain 1.43% year to date.
Technical indicators are showing a positive trend for Cardano cryptocurrency. Both the relative strength index and moving average convergence divergence suggest that ADA crypto is on the rise.
With the current RSI standing at 36, it suggests a move towards a neutral position. Moreover, the MACD line has crossed above the signal line, signaling a positive crossover. It would be wise to exercise patience and wait for favorable conditions before considering bullish positions.
Summary
Cardano price prediction shows that ADA cryptocurrency has been stuck in a descending triangle pattern on the daily chart since July 2023. However, it’s worth noting that the current trading volume is below the typical levels and would benefit from an increase during intraday trading. Examining the three-month window, ADA cryptocurrency has sustained a significant drop of approximately 4.85%. In the last six months ADA crypto slipped around 28.87%. Technical indicators are showing a positive trend for Cardano cryptocurrency.
Technical Levels
- Support Levels: $0.2440 and $0.2410
- Resistance Levels: $0.2535 and $0.2615
Disclaimer
The views and opinions stated by the author, or any people named in this article, are for informational purposes only, and they do not establish financial, investment, or other advice. Investing in or trading crypto or stock comes with a risk of financial loss.

Nancy J. Allen is a crypto enthusiast, with a major in macroeconomics and minor in business statistics. She believes that cryptocurrencies inspire people to be their own banks, and step aside from traditional monetary exchange systems. She is also intrigued by blockchain technology and its functioning. She frequently researches, and posts content on the top altcoins, their theoretical working principles and technical price predictions.


