
 Home
Home News
News
- 1 The Stacks’ price took resistance and decreased by 0.58% over the last week.
- 2 The price of the Stacks is trading at $0.4602 and the 52-week range is $0.2040 – $1.3250.
Stacks rose by 1.36% in market value and fell by 30.19% in trading volume in the last 24 hours, per CoinMarketCap, which is a crypto data website. Its market value is $648,187,437 and its trading volume is $19,632,624. There are 1,405,980,444 STX in circulation.
Muneeb Ali, the co-founder of Stacks, visited Korea on September 5th to participate in the Korean Blockchain Week (KBW) event. He explained the challenges of the Bitcoin network and how Stacks can solve them with Layer 2. He said that Layer 2 can offer faster and cheaper transactions and make it easy to move funds between Layer 1 and Layer 2.
Technical Analysis of STX on 1-D TimeFrame
Stacks price has been showing a bearish trend for the last three months, dropping by 14.28% in this time frame. The price has been making lower highs and lows, indicating a lack of buying pressure.
Currently, the Stacks price is trading at $0.4604 and facing resistance from a downward trendline that has been acting as a dynamic resistance since March 2023. The price is also below the 20 and 50-day exponential moving averages (EMAs), which are acting as additional resistance levels.
If Stacks price can break above the downward trendline and the EMAs, it could recover some of its losses and reach the next resistance levels of $0.4082 and $0.3154. These levels are based on the previous swing highs and lows.
However, if Stacks price fails to overcome the current resistance and continues to decline, then it might fall to the next support levels of $0.5344 and $0.6866.
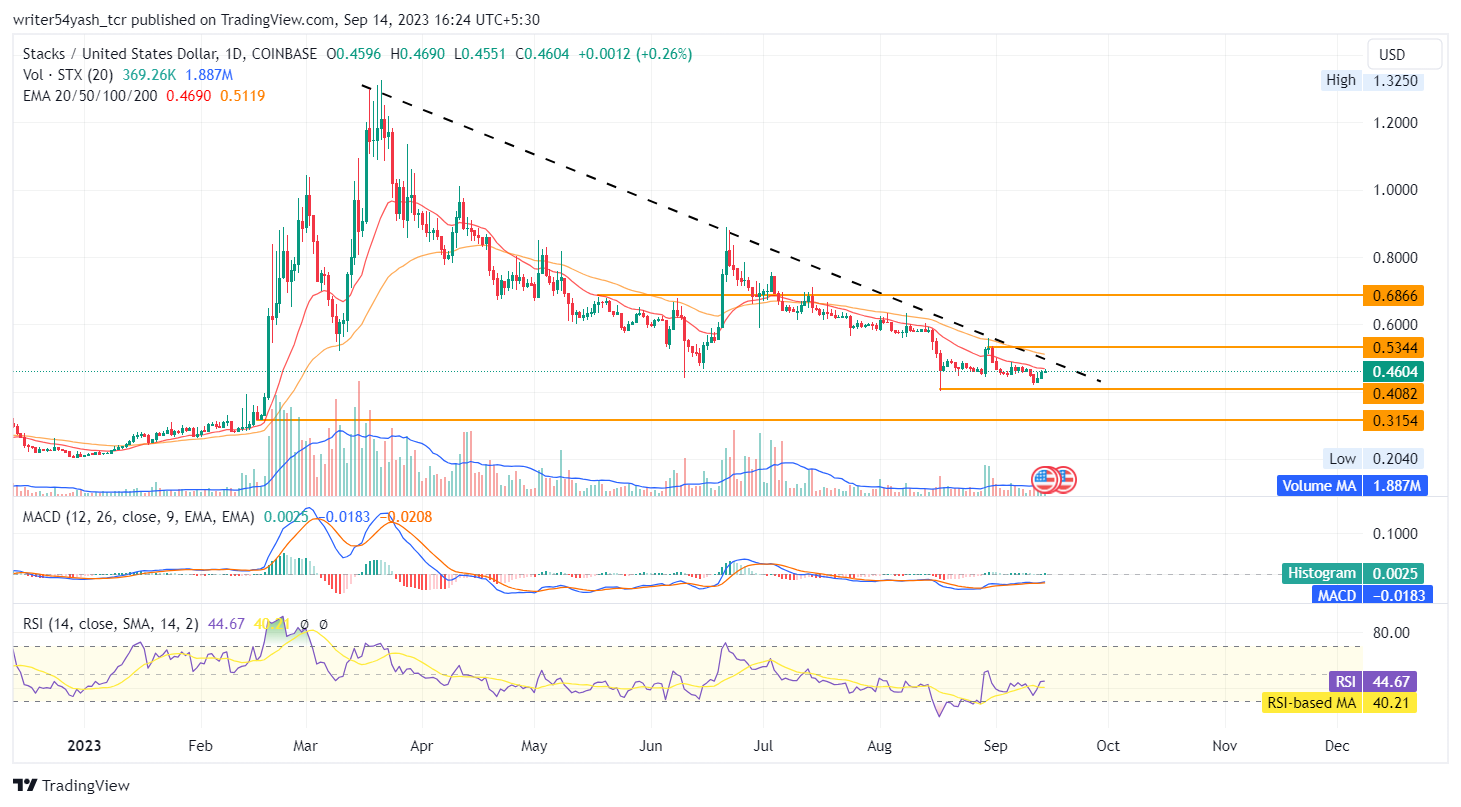
At the time of publishing, the Stacks price (STX) is trading below the 20 and 50-day EMAs (exponential moving averages), which are rejecting the Stacks price trend.
The MACD line at 0.0183 and the signal line at 0.0208 are below the zero line and both lines cross each other but the gap is lean in the MACD oscillator. The current value of the RSI is 44.85 points and the 14-day SMA is below the median line at 40.22 points. Collectively, the indicators view has consolidation to bearish.
Conclusion
The Stacks price prediction shows a neutral to bearish outlook from investors and traders in the daily time frame. STX price action reveals a neutral to downward trend at the time of writing. Moreover, the daily chart shows that the price might either consolidate or keep going down, according to widely used technical tools like RSI, EMA, and MACD.
Technical Levels:
- Support levels: $0.5344 and $0.6866
- Resistance levels: $0.4082 and $0.3154
Disclaimer
In this article, the views and opinions stated by the author, or any people named are for informational purposes only, and they don’t establish the investment, financial, or any other advice. Trading or investing in cryptocurrency assets comes with a risk of financial loss.

Andrew is a blockchain developer who developed his interest in cryptocurrencies while pursuing his post-graduation major in blockchain development. He is a keen observer of details and shares his passion for writing, along with coding. His backend knowledge about blockchain helps him give a unique perspective to his writing skills, and a reliable craft at explaining the concepts such as blockchain programming, languages and token minting. He also frequently shares technical details and performance indicators of ICOs and IDOs.


