
 Home
Home News
News
- 1 XRP price (XRP) surged 0.10% in the past 24 hours and is currently trading at $0.482.
- 2 XRP price dropped below the exponential moving average of 50 and 200 EMA.
The price prediction of XRP over the daily chart illustrates that the crypto price has declined eroding all the gains observed after a price hike in mid-July. The price is trading near the previous swing that caused the breakout. The price has wiped out nearly 75% while correcting since July 2023.
The daily chart shows that the XRP price declined after forming lower lows and lower highs. The volume analysis shows that the XRP crypto has received a total of $752.31 Million volume in the past 24 hours which is less than the average volume. XRP has a 2.95 as volume to market cap ratio indicating very low volatility in the market.
The XRP price also fell below the key moving average of 50 and 200-day EMA indicating weakness in the long-term as well as short-term. The bulls made several attempts to break above the previous swing high and shift the trend. However, they failed to make a change in the trend and the price slumped again.
The XRPL is a versatile platform for payments, micropayments, and DeFi. It was launched in 2012 and offers utility and flexibility to enterprises and developers using Python, Java, and JavaScript. The XRP website has various tutorials for different coding languages, app development, account management, and more.
XRP Price Declines Forming a Channel Pattern
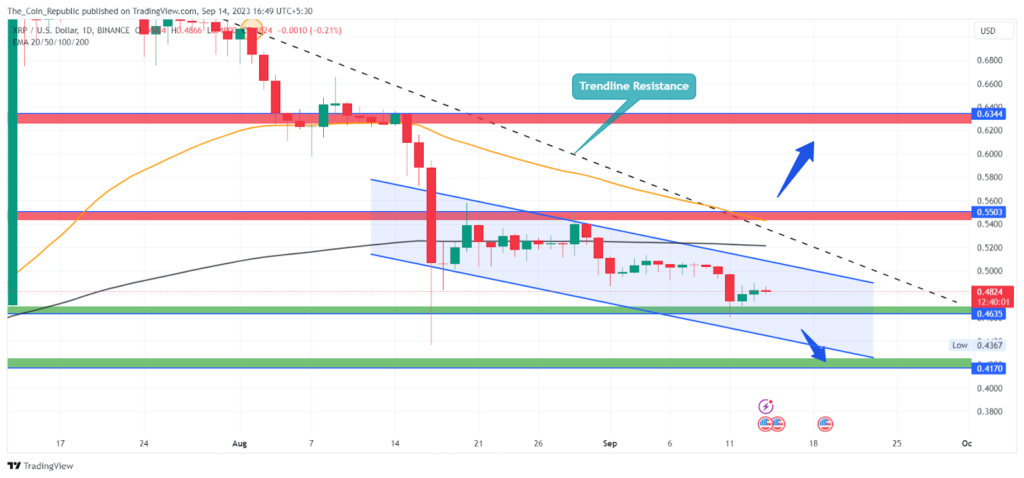
The XRP crypto price is currently trading at $0.482 and trying to sustain near the demand zone. The breakdown of this might drag the price to the lower support levels. The buying volume is low and unable to counter the bearish trend. The XRP crypto needs more buying volume to dominate against the selling pressure.
Technical Indicators Show Weakness Over the Charts
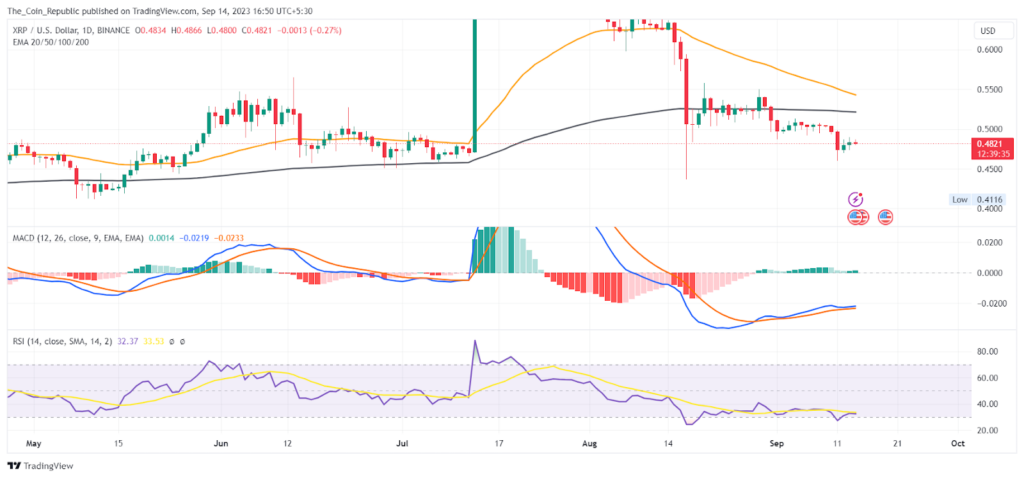
The technical analysis shows that MACD lines are showing a positive crossover. Histogram bars are also being formed above the mean line but of negligible height indicating the sellers are still dominant in the game.
The EMA analysis shows that the XRP price dropped below the 50 and 200-day EMA indicating the dominance of bears in the XRP crypto price.
At the time of publishing, the RSI value of the XRP token is 32.3 and that of the SMA line is 34.5. RSI is trading in an oversold region indicating weakness in the price.
Conclusion
The XRP price has been on a downtrend since July 2023, losing 75% of its value. The price is near the previous swing low and below the 50 and 200-day EMA. The volume is low and the market is weak. The XRP price needs more buyers to reverse the trend.
Technical Levels
- Support levels: $0.466 and $0.417
- Resistance levels: $0.553 and $0.634
Disclaimer
The views and opinions stated by the author, or any people named in this article, are for informational purposes only and do not establish financial, investment, or other advice. Investing in or trading crypto or stock comes with a risk of financial loss.

Nancy J. Allen is a crypto enthusiast, with a major in macroeconomics and minor in business statistics. She believes that cryptocurrencies inspire people to be their own banks, and step aside from traditional monetary exchange systems. She is also intrigued by blockchain technology and its functioning. She frequently researches, and posts content on the top altcoins, their theoretical working principles and technical price predictions.


